
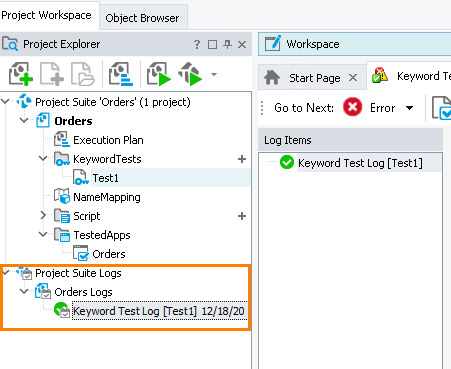
TestComplete keeps a complete log of all operations performed during testing. The links to test results are shown in the Project Explorer panel under the Project Suite Logs > Orders Log node. This is the primary workspace for looking up the test history of the project and project suite. Each node corresponds to a test run. An image to the left of the node specifies whether the corresponding test run passed successfully:
Note that TestComplete automatically adds nodes for the last results after the test execution is over. That is, the results are not displayed when the test is running (you can view intermediate results if you pause the test execution).
Since we have run only one test so far, we have only one log node in the Project Explorer. By default, TestComplete automatically opens the contents of this node in the Workspace panel. You can also view the log at any time. To do this, right-click the desired result in the Project Explorer panel and choose Open from the context menu.
| Note: | By default, TestComplete stores all test results in log files. The number of the log files will grow with every test run, and this will result in the memory consumption increase. To reduce memory usage, you can delete files from the log manually or limit the number of log files to be kept. |
In our example, the log is as follows:
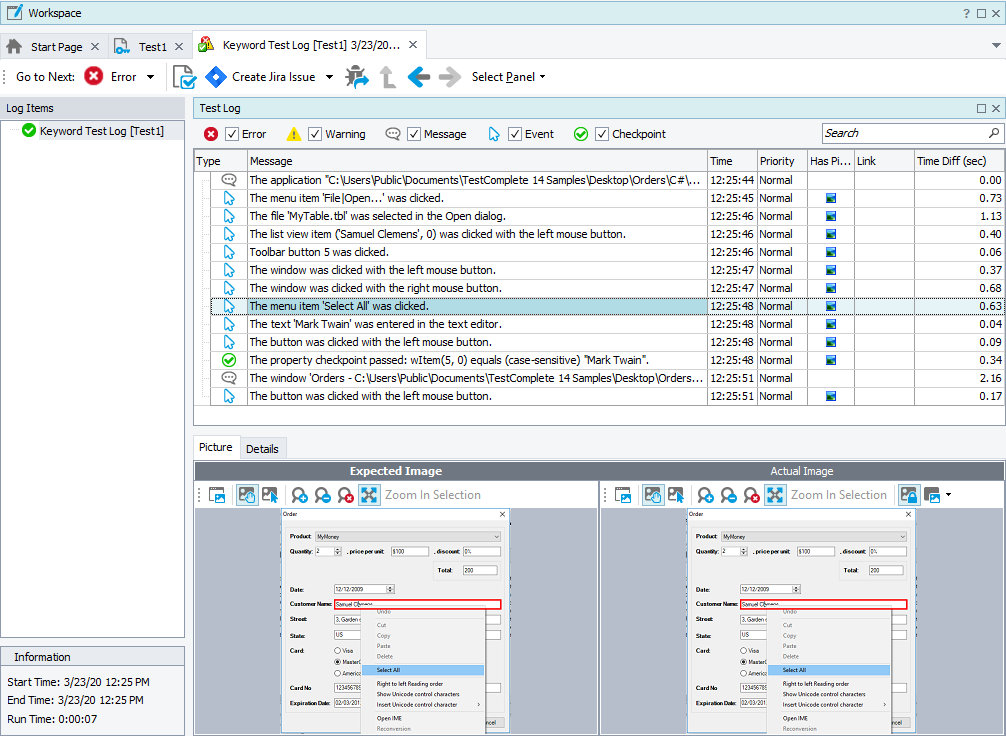
The log window shows the results of one test run at a time. On the left side of the window, there is a tree-like structure of the tests that were executed during the run; the node of each of these tests can be selected to view their results. For our example, we have run only one test, so in our case this tree only contains one node. The node icon indicates whether the test passed successfully or failed.
The test log contains error, warning, informative, and other types of messages. The icon on the left indicates the message type. Using the check boxes at the top of the message list you can hide or view messages by type.
For each message, the log also shows the time that each action was performed. You can see it in the Time column.
TestComplete may post additional text and images along with the message. To view them, simply select the desired message in the log and look in the Details and Picture panes that are below the message list. For instance, on the image above the Picture pane displays the screenshots associated with “The menu item 'Orders|Edit order...' was clicked” message.
The Picture panel displays the images that show the expected and actual application state before executing the selected test command (“Expected” is the image that was captured for the command during test recording, “actual” means the image that was captured during the test run). You can click  View Comparison Result to see the difference between the images. This simplifies the search for errors that may occur in your test. For more information, see topics of the Test Visualizer section.
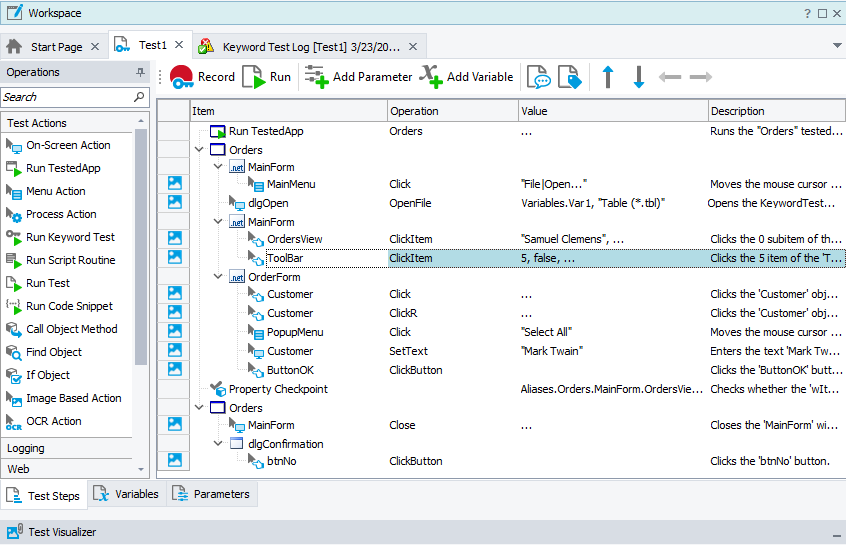
To view a test operation that posted a message to the log, double-click the desired message in the log. TestComplete will open the keyword test in the editor and highlight the appropriate operation. For instance, if you double-click the “Toolbar button 5 was clicked.” message in the log, TestComplete will highlight the keyword test operation that performed this action:
For detailed information on the test log panels, on posting messages to the log, and on working with the results, see the Test Results section.
| Note: | The log that we described is typical for TestComplete keyword tests and scripts. Tests of other types may form a log of a different structure. For detailed information about these logs, see the description of the appropriate project item or simply click within the log page and press F1. |
Resolving Errors
Your test may fail. There can be several possible reasons for this. For example, developers could change the application behavior, the recognition attributes of windows and controls could change and make the test engine fail to find the needed objects, a third-party application may overlap windows of your application and make the test engine fail to simulate actions on it, and so on.
One of the most typical reasons that novice users face is the difference in the application state during the test creation and playback. To avoid this problem, make sure that the initial conditions of the test run correspond to those you had when creating the test. For instance:
If your tested application had been running before you recorded a test, it must also be running before you run the test.
If test actions were performed on a particular window of the application, you should open the window when running the test.
If you edited any data in the application, and then saved it, you need to revert the changes.
If the tested application has changed and the identification properties that your test uses to find tested objects are no longer valid, TestComplete will try to detect the changes to find the missing objects. If your test log reports the “Object <Object_Name> was replaced with a similar object” warning, this means that TestComplete was not able to find the needed tested object during the test run and used a similar object instead.

Click the image to enlarge it.
Do not ignore this warning. Examine it to learn about the missing and the replaced objects and update the object’s identification properties to resolve the issue.
For information on searching for the cause of errors and resolving typical problems, see Handling Playback Errors.
 Prev
Prev
See Also
About Tested Application
Test Results
Handling Playback Errors