
After the build is finished, you can view results of your TestComplete tests in Jenkins.
You can view TestComplete test results for a build that uses the TestComplete Test step from the page of that build. If generating JUnit-style reports was enabled for your tests, you can also view these reports on various pages of your Jenkins project.
 JUnit-Style Test Reports
JUnit-Style Test Reports
If generating JUnit-style reports is enabled for your tests (see the description of the Generate JUnit-style report option of the TestComplete Test step or the description of the publishJUnitReports parameter of the TestComplete Test step for Pipeline scripts), the TestComplete Jenkins plugin creates reports similar to those generated by JUnit tests. You can view them on the following pages:
Project's Status Page
On this page, Jenkins displays a graph with test results for the builds that created JUnit-style reports. This graph shows the ratio of failed tests to the total number of tests. The graph counts only the builds for which JUnit-style reports were generated:

Click the image to enlarge it.
Click the graph to view detailed results for the needed build.
To display the test results of the latest build, click Latest Test Result on the left, or click the rightmost build in the graph.
To view the test results of a build that is not on the graph, open the build’s page and click Test Result.
Test Result Page
You get to the Test Result page by clicking a build link on the Status or History page of your Jenkins project, or by clicking Test Result in the menu on the left.
On the Test Result page, you can examine the results of a test run. Below is a sample view of the page:

Click the image to enlarge it.
At the top of the page, Jenkins displays summary information about the executed tests and their total execution time.
Click add description to specify a description for the test run. You will see it on the Test Result and History pages.
If the test run failed, the page contains the All Failed Tests section (as on the image above). Click an item in this section to view information about the failure.
The All Tests section provides brief information on the executed TestComplete tests during the build process:
-
Package level results in this section represent project suite runs.
-
Class level results correspond to projects in a project suite.
-
Test level results correspond to individual test items or individual tests in a project.
Click items in the All Tests section to view details information about them.
| Tip: | For convenient viewing of test results, install the Test Results Analyzer Jenkins plugin. |
History Page
The History page displays the statistics of test runs for your builds. To open the page, select History from the menu on the left. Below is a sample view of the page:

Click the image to enlarge it.
The graph at the top of the page shows the execution time of the tests and the ratio between the failed and passed tests. Click show count to view the number of executed tests rather than time.
The table below the graph contains information on each build: test duration, and the number of failed, skipped and total tests per build. The TestComplete Jenkins plugin does not skip tests, so the number of skipped tests is always 0.
Click a build number in the table to view information about test runs in that build.
TestComplete Test Results for a Build
To view TestComplete test results in Jenkins, open the build page in your browser and click TestComplete Test Results in the menu on the left:

Click the image to enlarge it.
The page displays a summary of TestComplete test runs, information on what nodes tests ran, their run time and the number of logged errors and warnings.
Depending on the test results, the following statuses can be displayed:
| Status | Description |
| The test did not start. Click the test name to find out what happened. | |
| Errors occurred during the test execution, or the test did not finish. | |
| Warning messages were logged, but no errors occurred and the test finished. | |
| No errors or warnings occurred during the test execution. |
To view a detailed test log of a test run, click the test name. The TestComplete Test Result report for the run will be opened:

Click the image to enlarge it.
The report is similar to the TestComplete Test Log.
To download the test log in the .tcLogX format , click the  Download Log File (tcLogX) button:

Click the image to enlarge it.
To view a .tcLogX file, add it to your TestComplete project:
-
In your project, right-click the Project_name Logs item in the Project Explorer and select Add > Existing Log File from the context menu.
-
Navigate to the .tcLogX file using the standard Open File dialog and click Open.
-
TestComplete will add the file to your project and you will be able to view it in the Test Log panel.
If generating MHT logs was enabled for your tests (see the description of the Generate MHT Log File option of the TestComplete Test step or the description of the generateMHT parameter of the step for Pipeline scripts), you can download test results in the .mht format. Click the  Download Log File (MHT) button:

Click the image to enlarge it.
| Note: | You can open .mht files only in Internet Explorer. |
For information on viewing TestComplete test results, see also Viewing Test Results in Web Browsers.
Accessing TestComplete Test Results Through APIs
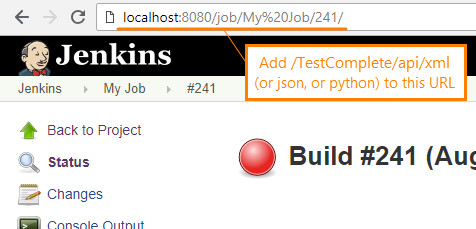
To get the results of TestComplete tests via an API, send GET requests like the one below to your Jenkins server:
http://localhost:8080/job/My%20Job/241/TestComplete/api/xml
Here:
-
localhost:8080 — The name and port of your Jenkins server. The server name in our example is localhost. Instead of the name, you can also specify the server’s IP address. Also, in our example, we use port 8080 — the default port that Jenkins uses. Your server can use another port.
-
My%20Job — The URL-encoded name of the job (freestyle or Pipeline) that ran TestComplete tests.
-
241 — The number of the job run (decimal, integer).
-
xml — A constant that indicates the format of the resulting data. In our example, we use
xml. Other possible values includejsonandpython:http://localhost:8080/job/My%20Job/241/TestComplete/api/json
http://localhost:8080/job/My%20Job/241/TestComplete/api/python
The easiest way to get the URL is to open the page with the build results in a browser, copy the URL from the browser’s address bar and add the /TestComplete/api/{data-format} constant to it:
Result structure
Here is an example of XML data Jenkins returns. Results in the JSON and Python formats have similar elements:
XML
<tcSummaryAction _class="com.smartbear.jenkins.plugins.testcomplete.TcSummaryAction">
<report>
<agent>Jenkins</agent>
<details>
<duration>4806</duration>
<errors>0</errors>
<timestamp>1535544341163</timestamp>
<warnings>0</warnings>
</details>
<error/>
<exitCode>0</exitCode>
<failedToStart>false</failedToStart>
<success>true</success>
<testName>
Orders_C#_JavaScript/Orders_C#_JavaScript/Orders_JavaScript/Main
</testName>
<url>
http://localhost:8080/job/TestJob/6/TestComplete/reports/3536754
</url>
</report>
<tcSummaryAction>
If you use the XML format, the root node is tcSummaryAction. The JSON and Python formats don’t use root nodes.
Child nodes:
-
report— Contains the results of the TestComplete build step that was run in your job. If your job has several TestComplete steps, the results will have severalreportnodes.-
agent— The name of the node the test was run on. Returns Jenkins if the job was run on the master machine. -
details— Detailed information on the TestComplete build step execution. Has the following child nodes:-
duration— The test run duration in milliseconds. This value is rounded down to seconds. For example, for a test running for 8.124 seconds, this node will return 8000. -
errors— The number of errors posted to the test log during the test run. -
timestamp— The time passed from January 1, 1970 to the start of the test (in milliseconds). -
warnings— The number of warnings posted to the log during the test run.
-
-
error— The text of an error returned by TestComplete. Empty, if TestComplete returned no error text. -
exitCode— The exit code returned by TestComplete. -
failedToStart— Indicates whether the test started.falseif the test started;trueotherwise. -
success— Indicates whether the test was successful or not.falseif the test did not start. -
testName— The full name of the executed test. Includes the project name, project item name, script unit name (for scripts) and the test name. -
url— The URL you can use to see the test results.
-