Windows
Windows-based servers use the Performance Data Helper (PDH) component to expose performance metrics to ReadyAPI. This component is available in all Windows versions. To obtain data from a remote host, the following requirements should be met:
-
ReadyAPI must run on a Windows machine. Windows, IIS and MSSQL monitors are not available on Linux and macOS machines.
-
The account used to connect to the server must belong to one of the following user groups on it:
-
Performance Monitor Users
-
Performance Log Users
-
Administrators

The Performance Monitor Users and Performance Log Users groups are not available in Windows XP. If you use this Windows version on the remote machine to be monitored, add the needed user account to the Administrators user group. -
-
The Remote Registry Windows service must be enabled and started on the monitored remote machine. This service is disabled by default on Windows Vista and later. If the server resides on the same computer where ReadyAPI is running (that is, if the localhost server is being monitored), this requirement is optional.
To enable the Remote Registry Windows service, press
WIN+R, and start the services.msc process. In the Services application, right-click Remote Registry and select Start.
IIS
To monitor the IIS server, you need to set it up in the same way as Windows servers.
MSSQL
To monitor the MSSQL database, you need to set it up in the same way as Windows servers.
Unix
-
You need to have Net-SNMP installed on your server. To check if Net-SNMP is installed, use the
snmpd --versioncommand.-
If you have Net-SNMP installed, you should see the SNMP version number as well as the web address and email.
-
If you do not have Net-SNMP installed, use one of the following commands (depending on the kernel version):
– either –
sudo apt-get install snmpd– or –
sudo apt-get install snmp
-
-
Then, edit the /etc/snmp/snmpd.conf file. This requires sudo privileges. Uncomment the following agent behavior line:
agentAdress udp:161,udp6:[::1]:161 -
To allow your computer to access server metrics using the public community string, add the following line to the snmpd.conf file:
rocommunity public
If you are not sure how to configure Net-SNMP to suit your needs, you can just replace the whole text in a file with the line above. -
Then, edit the /etc/default/snmpd file and make sure the row that begins with SNMPDOPTS does not contain any trailing addresses.
For example, if the row in question is:
SNMPDOPTS=''-Lsd -Lf /dev/null -u snmp -I -smux -p /var/run/snmpd.pid 127.0.0.1'Make it:
SNMPDOPTS=''-Lsd -Lf /dev/null -u snmp -I -smux -p /var/run/snmpd.pid' -
After changing the configuration of snmpd, restart the server. Execute the following command:
/etc/init.d/snmpd restart
Apache
To monitor Apache servers using ReadyAPI, the mod_status module must be enabled. This module is available as part of a standard installation of either the Apache 1.x or Apache 2.x package, and the configuration is very straightforward.
To enable status reports only for some domain, add the following line to the httpd.conf file, preferably to the bottom:
To use extended counters, add this line to the httpd.conf file:
You need Apache 1.3.2 or higher to access extended counters.
On UNIX machines, you will also need to specify the following settings:
If the configuration files are stored in the /etc/apache2 directory, add the following line to the /etc/apache2/apache2.conf file:
You might also need to comment out the following line from the /etc/apache2/mods-available/status.conf file. Add # at the beginning of the line:
MySQL
To access the MySQL database monitor, you need a database user account. This user does not need any privileges.
To create a new user, use the following command:
Also, download the MySQL Connector and put it into the ReadyAPI\bin\ext directory.
Oracle
To access the Oracle database monitor, you need a database user account. This user needs access to the V$METRIC table.
WildFly
To monitor the WildFly server, you need to:
-
Copy the jboss-cli-client.jar library to the <ReadyAPI installation>\bin\ext folder. You can find it in the <WildFly installation>\bin\client folder.
-
Use the management user account to connect to the server. See the WildFly documentation for information about adding users.
Tomcat
To use the Tomcat monitor, enable JMX monitoring on the server. Add the following parameters to the Tomcat startup script:
-Dcom.sun.management.jmxremote
-Dcom.sun.management.jmxremote.port=8999
-Dcom.sun.management.jmxremote.ssl=false
-Dcom.sun.management.jmxremote.authenticate=false
If you plan to add server authorization, refer to the Enabling JMX Remote topic in the Tomcat documentation.
MongoDB
You do not need to prepare MongoDB servers to monitor them.
WebLogic (deprecated)
 |
This feature is deprecated. The WebLogic monitor is no longer available since ReadyAPI 3.3.1. |
To enable WebLogic server monitoring, you need to:
-
Copy the wlclient.jar library to the <ReadyAPI installation directory>\bin\ext folder from the <WebLogic installation>\Oracle\Middleware\wlserver_10.x\server\lib folder.
-
Create a user on the server with membership in the Monitor or Admin group.
-
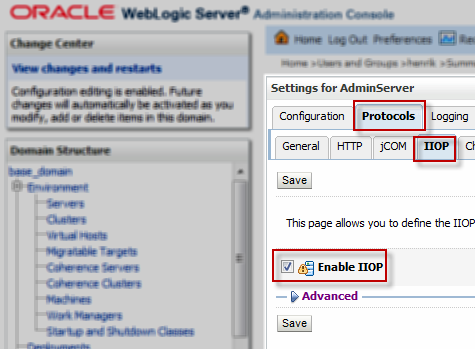
Enable IIOP on the server.
-
Restart the server.
To configure the server:
-
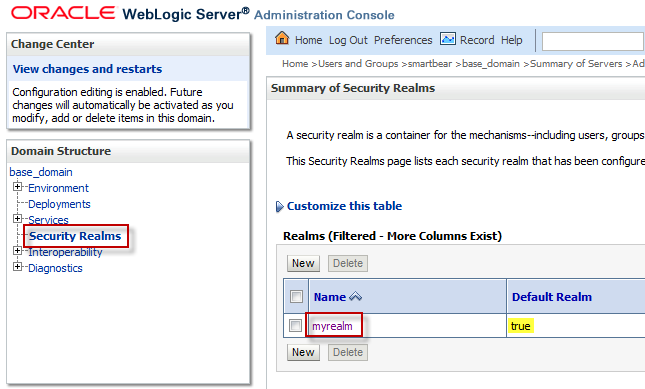
In the Administration Console, click Security Realms and then select the default realm.
-
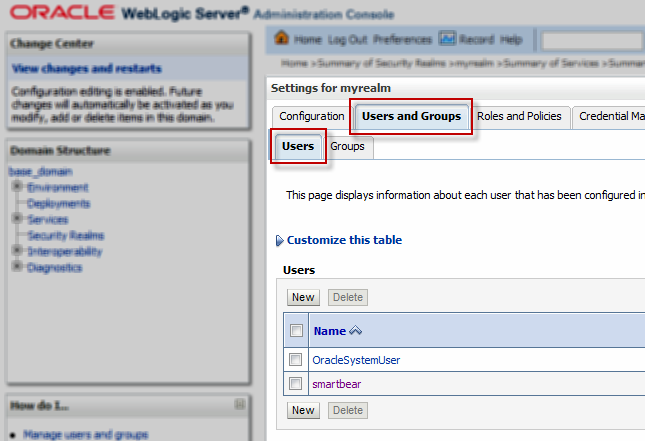
Click Users and Groups and make sure the Users tab is selected. Create a new user by clicking New if necessary, and then select the needed user in the list.
-
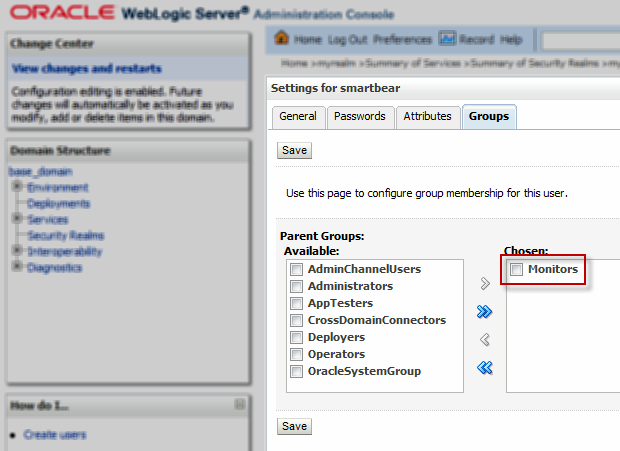
Navigate to the Groups tab and make the user a member of the Monitors group. Click Save.
-
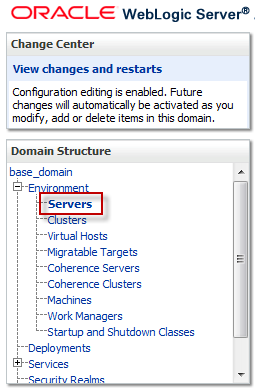
Select Servers and click the server that you want to monitor.
-
Make sure that the Enable IIOP check box is checked in the Protocols > IIOP tab.
-
Click Save.

