These reports are available on the Reports > Legacy Reports page.
Resource Availability report
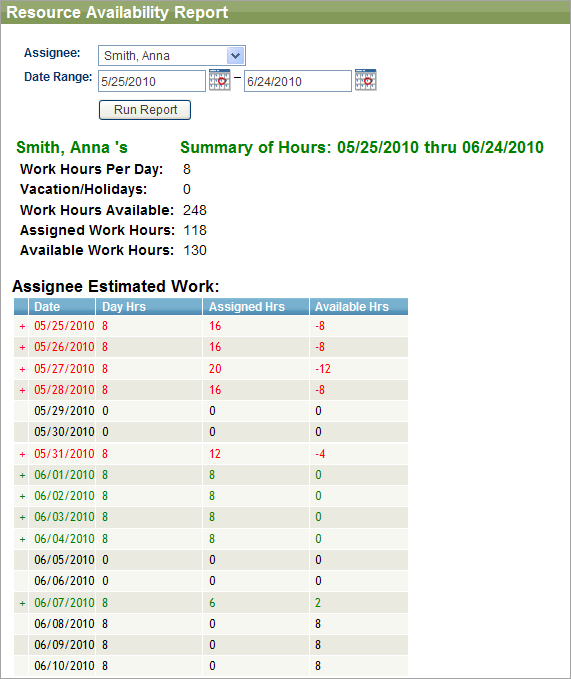
On this chart, you can drill down to the Resource Availability report for a selected user.
You can run this report for any time frame by changing the date range. It defaults to starting with today and ending in 30 days.
The report shows a team member’s normal work hours per day, if any vacation or holidays are within the date range, total available hours, how many of those hours are assigned and how many are still available.
Each day is listed on the report. The date is red for days that a team member is over allocated, black for unassigned or not working, green for properly allocated.
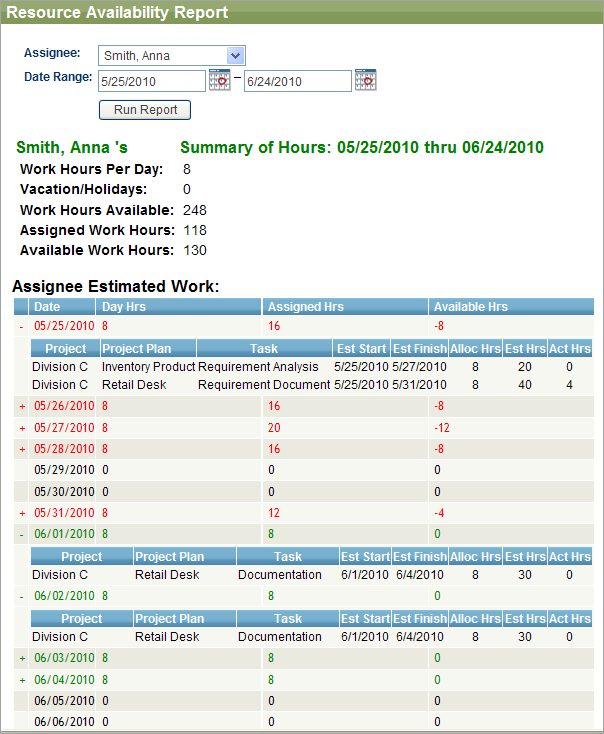
Click on the plus icon to see the details for the day:
The day is expanded to show you what project, project plan, task, estimated start and finish dates, allocated hours, estimated and actual hours. This is reported across projects so you can see exactly what a team member has been assigned.
Additionally, you can access the following reports in Project Management:
-
Gantt Chart – This report shows the tasks in a graphical format to allow you to determine the dependency between tasks and the progression towards completion. The Gantt chart can be run across projects, for specific project plans and/or assignees and by date range.
-
Project Plan Task Index Cards – Run for a specific release, this returns a quick view of assigned project plan task in index card format.
-
Project Profitability Report by Project Plan Assignee (Project Manager) – Run for a specific time period, this report analyzes all completed project plans (percentage complete of 100%) and shows the profitability of each task on the project plan. The profitability is calculated as the external costs minus the internal costs (what you sold it for against what it cost you). This specific report is grouped by project manager, allowing you to compare one project manager’s profitability to another’s.
-
Project Profitability Report by Project Plan Owner – Run for a specific time period, this report analyzes all completed project plans (percentage complete of 100%) and shows the profitability of each task on the project plan. The profitability is calculated as the external costs minus the internal costs (what you sold it for against what it cost you). This specific report is grouped by owner, allowing you to compare one owner’s profitability to another’s.
-
Release Report – This report shows everything associated with a specific release (requirements, test runs, defects, project plan tasks, and agile tasks).
-
Resource Allocations by Assignee – This report shows all tasks assigned to each employee beginning on a specific date.
-
Resource Allocations by Project, Project Plan, Assignee – This report shows all tasks assigned to each employee beginning on a specific date for a specific project and project plan.
-
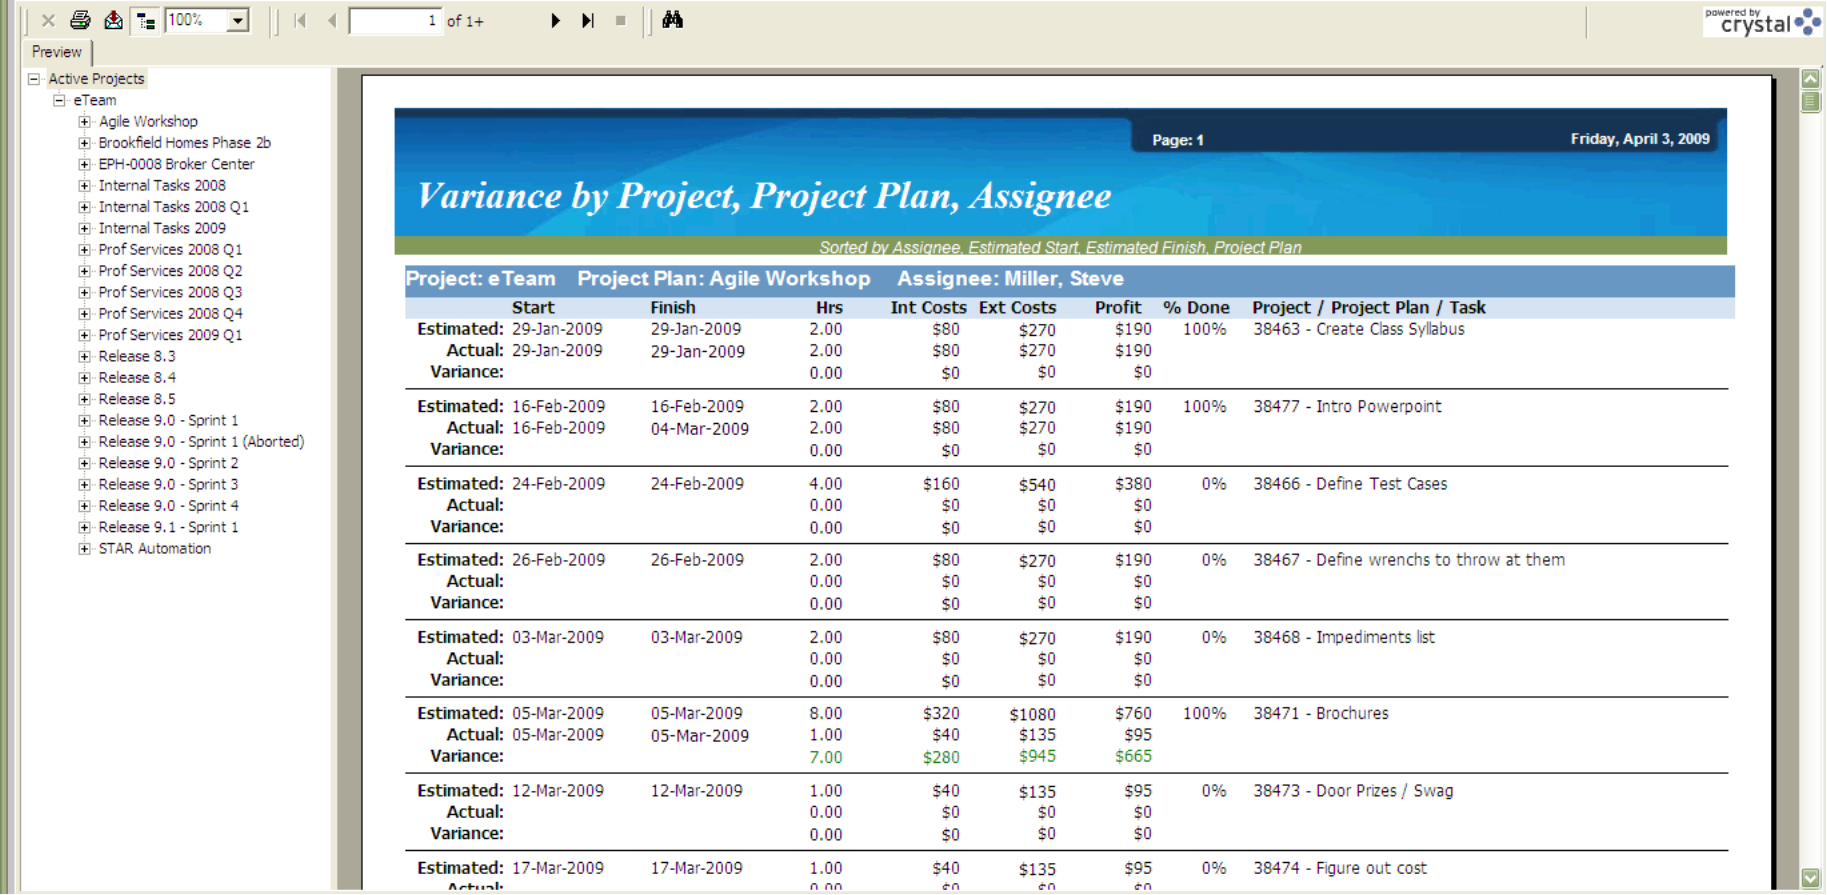
Variance by Project, Project Plan, Assignee – This report shows estimates vs. actual for each project, project plan, and assignee. This can be used to determine what project plans were delivered below, on or over their estimates and what individuals on the team came in below, on or above their estimates. This can be used to help team members improve their estimating skills.
-
Variance by Project, Project Plan, Owner – This report shows estimates vs. actual for each project, project plan, and owner. This can be used to determine what project plans were delivered below, on or over their estimates and what owners (this is normally the product manager or supervisor) on the team came in below, on or above their estimates. This can be used to help team members improve their estimating skills.
Timesheet reports
Timesheet reports show who worked on what and are found under Reports > Timesheets.
-
Timesheets by Project Plan, Week – This report shows all timesheets entered for each project plan and separates them by week. It can be run to begin showing timesheets at any week desired.
-
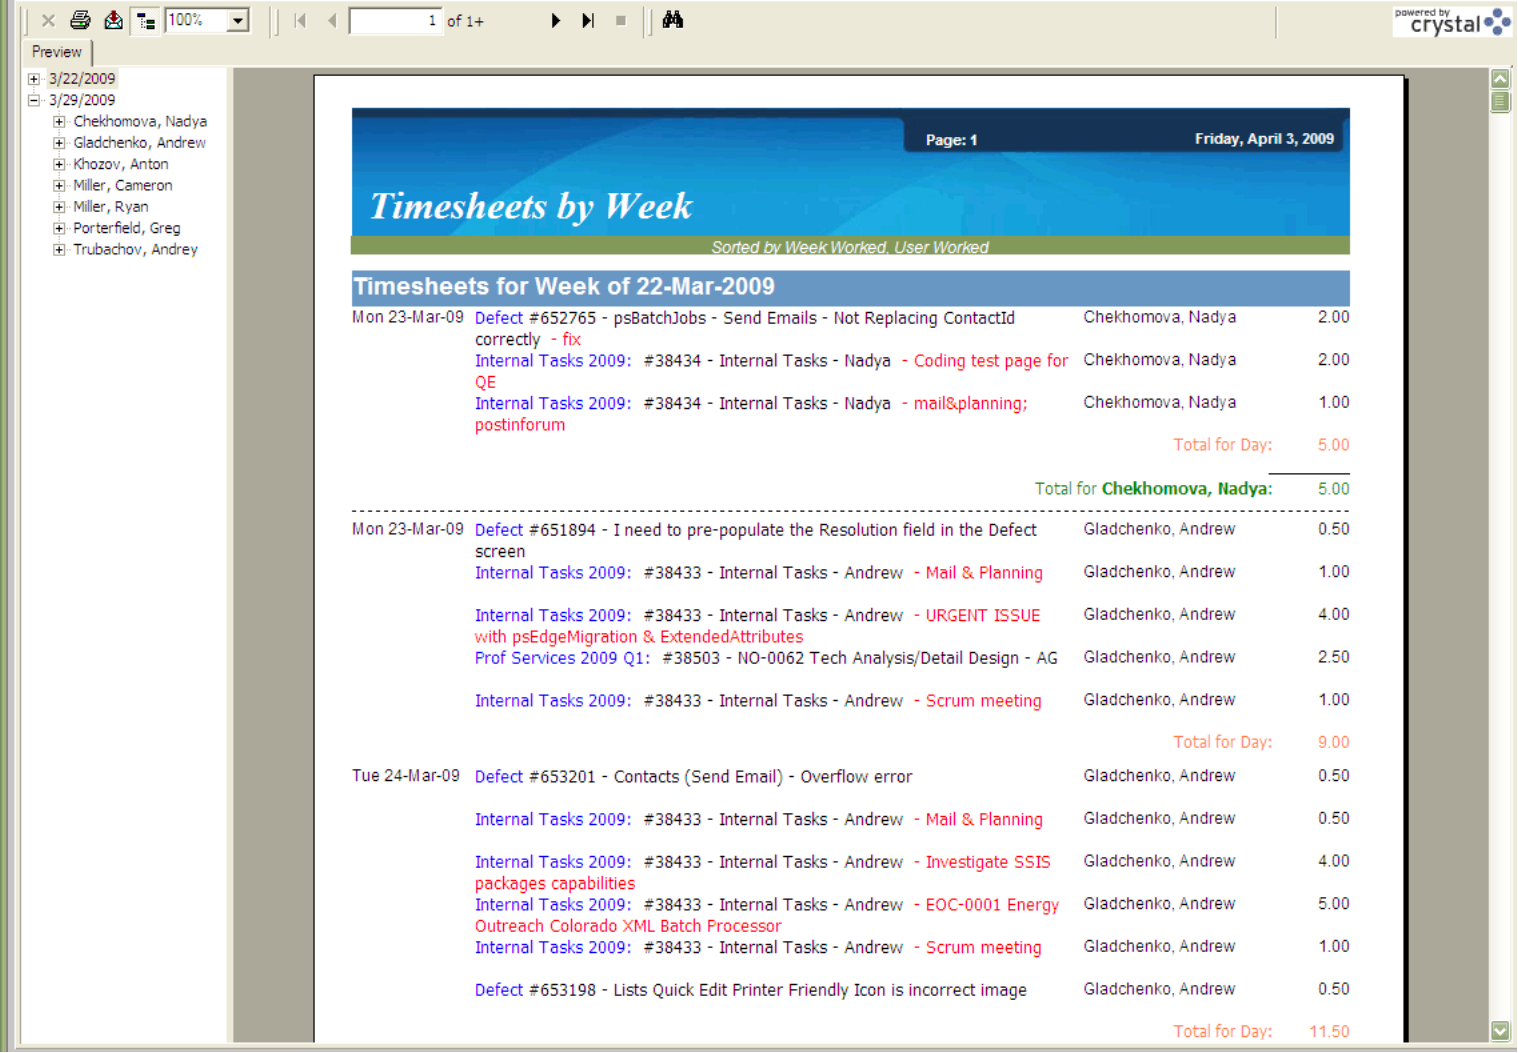
Timesheets by Week – This report shows all timesheets entered for each week, regardless of what project plan they were applied to. It can be run to begin showing timesheets at any week desired. This can be used to determine what each individual has worked on for each week.


