After you have chosen what code will be profiled and when, you need to define what information the profiler run will provide. You can specify it by selecting the appropriate profiler.
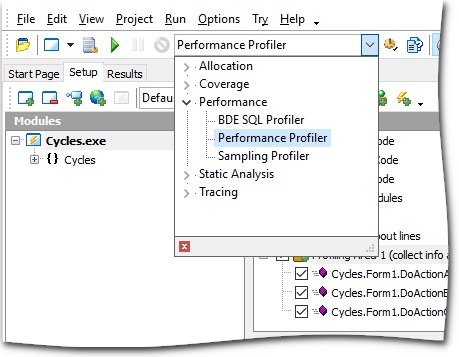
The profiler to be run is set from the drop-down list on the Standard toolbar, just to the right of the  Run button:

The drop-down list is actually a tree view. Individual profilers are listed when you open a branch.
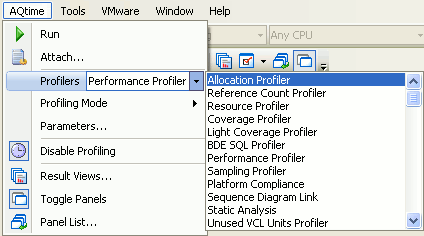
The profiler to be run is set from the Profiler drop-down list in the AQTime menu:

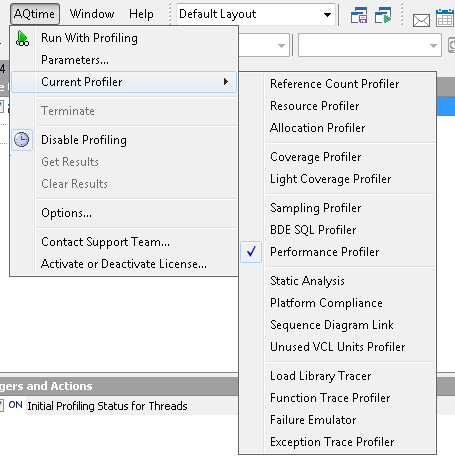
The profiler to be run is set in the Current Profiler submenu of the AQTime menu:

