We will call any function that calls itself or that is eventually called by a child function recursive. In AQTime terms, a recursive function is one that belongs to its own descendants (children, grandchildren, etc.). For the Performance profiler, this poses an unavoidable problem regarding what AQTime should call Time with Childrenand what it should call Time (that is, without children) for this type of a function.
This topic explains the Time with Children problem for recursive functions, and the solution that is adopted by the Performance profiler.
| Note: | Time with Children present in the Performance profiler results only if you use the Elapsed Time, User Time or User+Kernel Time counters. If you profile your application with any other counter, for example, with CPU Cache Misses or Hard Memory Page Faults, Time with Children as well as other “Timing” results (such as Average Time, Min Time, etc.) will be replaced with similar values: Misses With Children, Faults with Children, Average Misses, Average Faults, etc. AQTime calculates these values in the same way it calculates the “Time” values. In further explanations we will use “Time”, but since the results are similar, the explanations are also true for “Misses”, “Faults” and other results. |
Time and Time with Children apply not to one call, but to the sum of calls throughout the profile run. Now, imagine that one function, FuncA, calls itself three times in a row, so that the original call, FuncA1, gives rise to three more, FuncA2, FuncA3 and FuncA4. Imagine also that FuncA takes 2 seconds to execute its own code. If these are the only calls during the profile run, Time should be 8 seconds. But Time with Children?
FuncA4 = 2
FuncA3 = 4
FuncA2 = 6
FuncA1 = 8
Total = 20 seconds
Now, imagine that the entire run was simply the original FuncA1 call. The entire run lasted 8 seconds, but Time with Children for FuncA is 20 seconds. This is grossly misleading. The reason is that one single execution, FuncA4, is counted separately as part of the child time for FunA3, FuncA2 and FuncA1, and it is also counted once as its “own” time - it is counted four times in all. Likewise, FuncA3 is counted three times and FuncA2 is counted twice. These repeat counts for the same actual execution bloat up Time with Children as soon as there is recursion.
In the very simple example above, we also know what solution we would like to see; Time with Children should be identical to the run time, 8 seconds. That is, the same as Time itself, since both values count exactly the same calls (FuncA1 through FuncA4).
The Performance profiler detects the recursive calls and counts Time and Time with Children for recursive functions properly. With our simple FuncA example, this means FuncA2, FuncA3 and FuncA4 contribute nothing to Time with Children, so it remains what it was for FuncA1 alone, 8 seconds, the same as the run time. This is what we wanted.
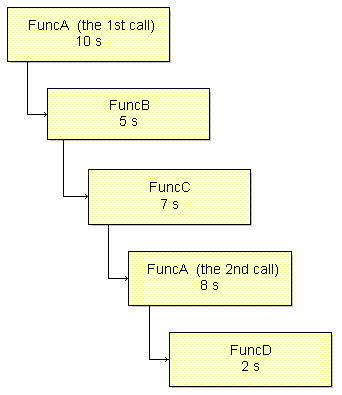
Just to make sure everything is clear; here is a somewhat more complex example:

The timings are time spent executing the function itself.
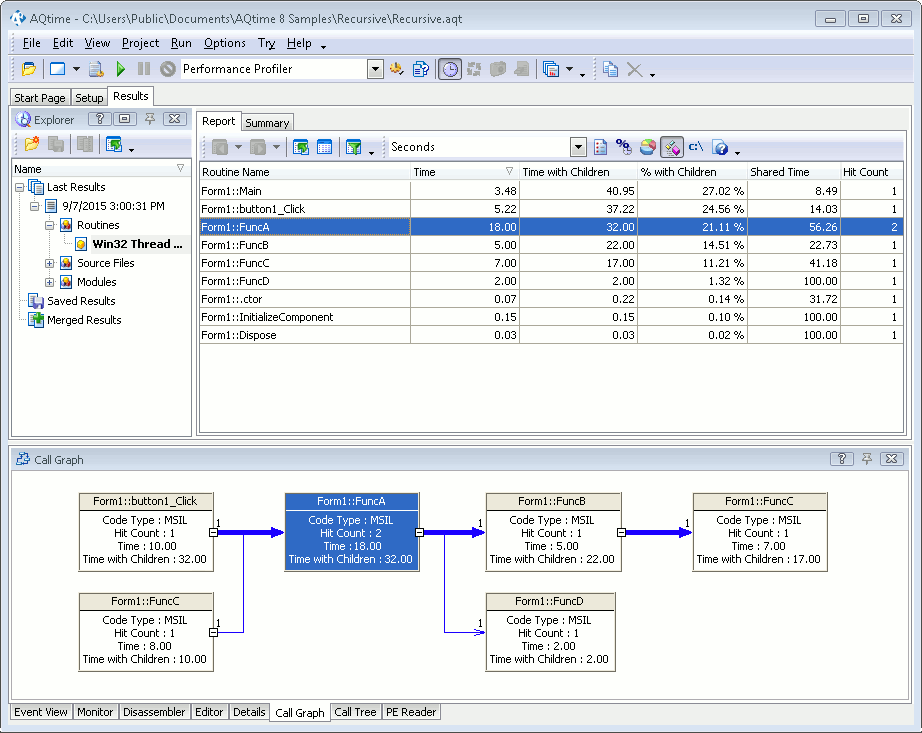
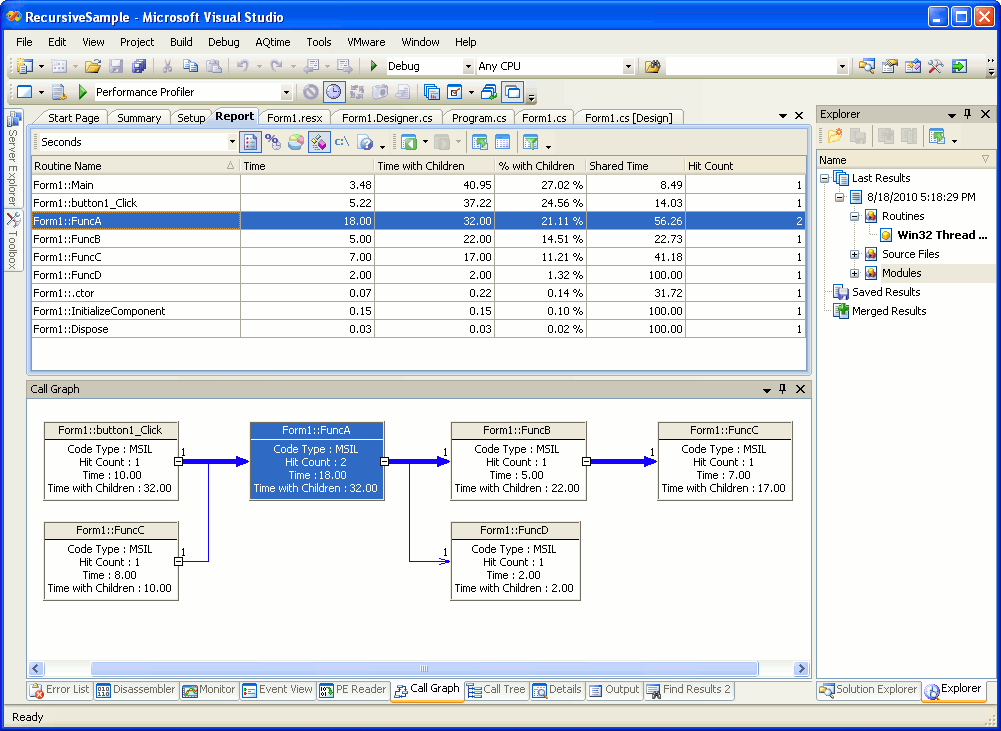
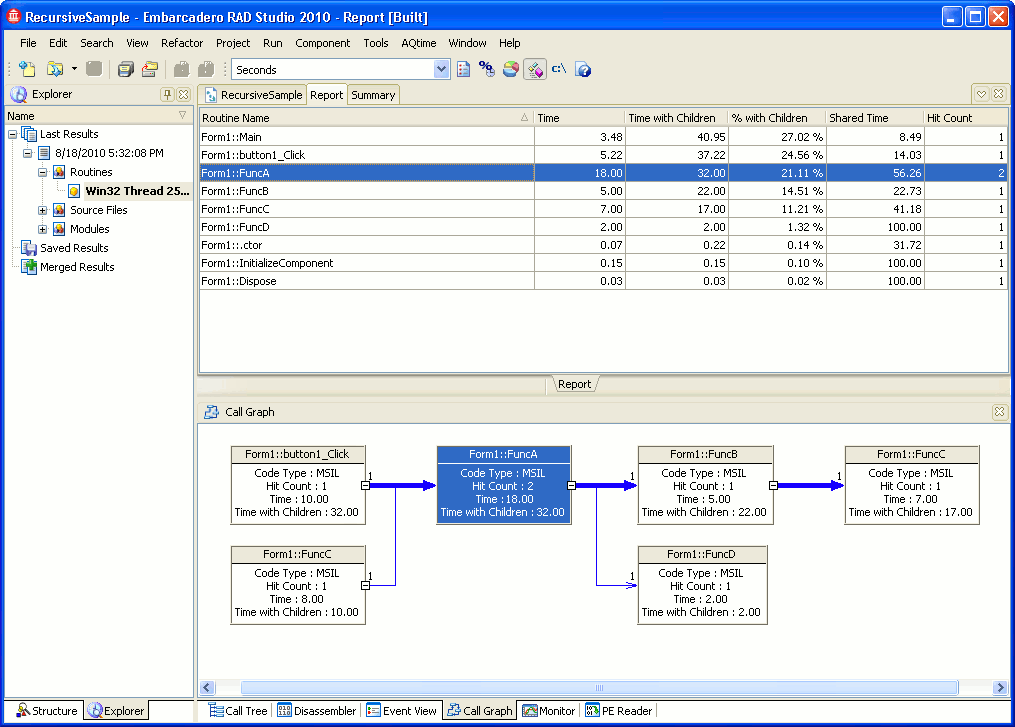
The Performance profiler will report the following results:
The net time of FuncA is about 18 seconds (10 seconds for the first call plus 8 seconds for the second call). FuncD and FuncB are child routines of FuncA. The Time and Time with Children results for them corresponds to the actual execution time of these routines. FuncC is a parent routine for FuncA. As we can see, the net time of the FuncA call, which was made within FuncC, is about 8 seconds and Time with Children is 10 seconds. These values also match to the actual time of function calls.
| Note: | If the first call to FuncA is not profiled for any reason (for instance, it is excluded by an off-trigger), the Performance profiler detects no recursion. |


