This topic explains how to prepare applications created with Embarcadero Delphi XE6 - XE8 and 10 - 10.3 for AQTime. To learn how to prepare applications created with other Delphi versions, see Compiler Settings for Native Applications.
To prepare a Delphi application for AQTime, first of all, you need to make sure that it includes debug information. Follow these steps:
-
Open your project in Delphi.
-
Activate the configuration that you use to build the debug version of your application. To do this, right-click the Project_Name > Build Configurations > Debug_Configuration node in the Project Manager and select Activate from the context menu.
Note: You can build your application in any configuration, not just in the debug one. We choose the debug configuration to make sure that the changes that will be made to compiler settings will not affect the release configuration which is typically used to build the final version of applications. -
Choose Project > Options from the main menu to open the Project Options dialog.
-
In the Target combo box, select your debug configuration. If your project includes multiple platforms (for example, 32-bit and 64-bit Windows), you can select the debug configuration either for a specific platform or for all platforms.
Delphi will load the project options for debug builds.
-
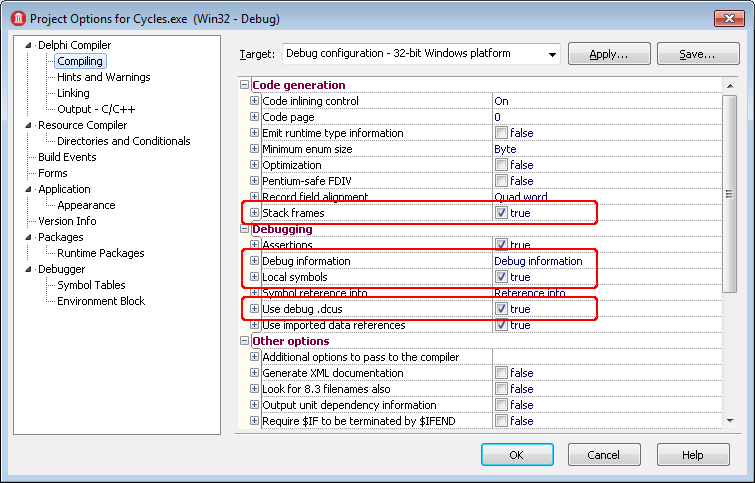
In the tree on the left of the dialog, select the Delphi Compiler > Compiling category:
-
In the Code generation group, set the Stack frames option to True.
-
In the Debugging group, set the Debug information option to Debug information. This instructs the compiler to generate debug information for the application consisting of line-number tables for each procedure.
-
To include local symbol information (names and types of local variables and constants in each module), set the Local symbols option to True in the Debugging group.
-
If you are going to profile VCL classes, for example,
TDataset, set the Use debug .dcus option to True in the Debugging group. Otherwise, AQTime will only be able to profile the classes that are defined in your application.
-
-
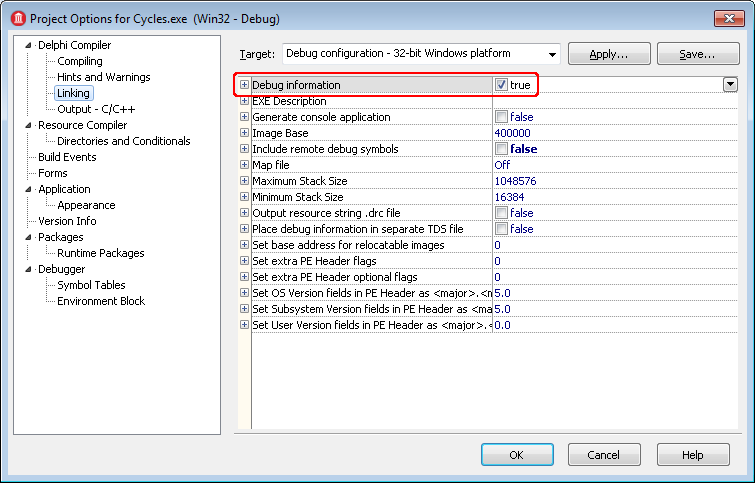
Switch to the Delphi Compiler > Linking category and set the Debug information option to True.
-
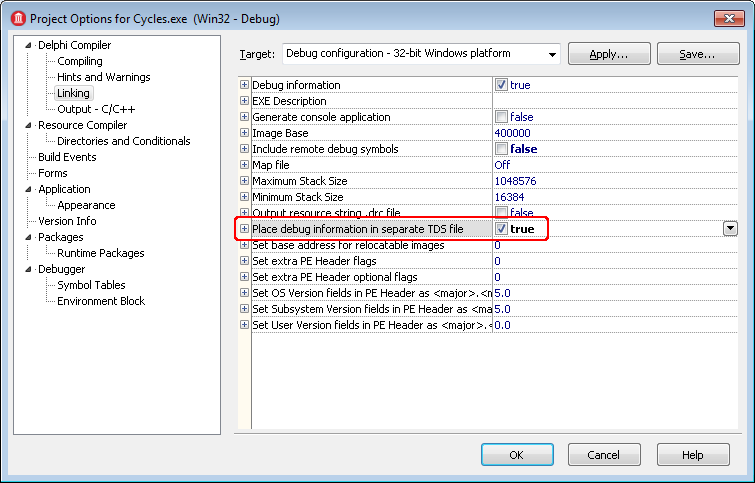
(For 32-bit applications only) If you want debug information to be stored in separate TDS files rather than inside application modules, set Place debug information to separate TDS file to True.
-
(Optional). Due to specifics of the Delphi compiler, mangled function names in generated debug info will have a format that differs from the regular format. AQTime may not be able to unmangle them properly. For instance, the constructor of the TObject class will look like @System@TObject@$bctr in AQTime panels.
To avoid this, switch to the Delphi Compiler > Output - C/C++ category and set the C/C++ Outputfile generation option to Generate all C++ Builder files (including package libs).
-
If you are not going to use the Allocation profiler, skip this step.
Note that the point of the Allocation profiler is not to check performance. It is designed to track memory allocations and deallocations. To do this, the profiler requires access to the basic VCL objects (
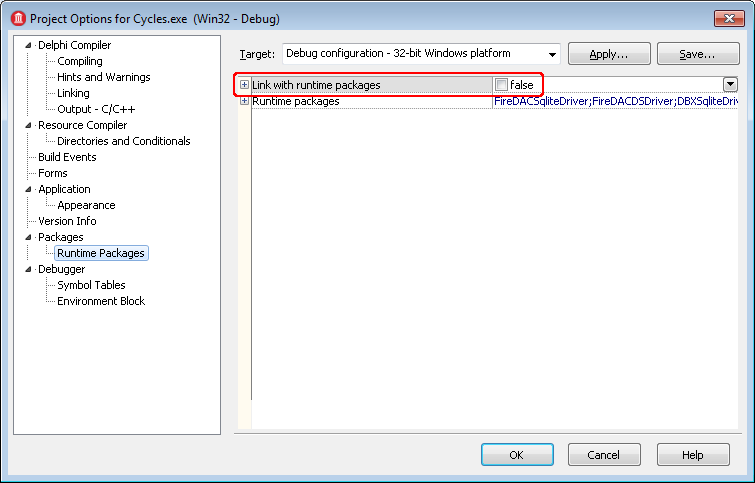
TObjectandTInterfacedObject). The easiest way to provide access is to turn off the Link with runtime packages option in the Packages > Runtime Packages category.
If you want to use the Link with runtime packages option (for instance, to control the exe size), you can still use the Allocation profiler. When you include your application in an AQTime project, you will also have to include the <Windows>\System32\RTL160.BPL file. To add a module to an AQTime project, press
 Add Module on the Setup toolbar or select it from the Setup context menu.
 -
Once you have set the compiler and linker options correctly, rebuild your application and it will be ready for profiling. If you are profiling an ActiveX control or a COM server, you need to register its “debug” version in the system (See Profiling COM Applications).
When your application is ready for release, remember to recompile it without debug information to reduce the application size.
| Note: | AQTime is incompatible with some third-party tools that modify the binary code of your application (for example, those that add a custom exception handling mechanism). An example of such a tool is EurekaLog. We recommend that you profile your application before processing it with such tools. |


