This topic explains how to prepare applications created with CodeGear Delphi 2007 for Win32 for AQTime. To learn how to prepare applications created with other Delphi versions, see Compiler Settings for Native Applications.
To prepare a Delphi 2007 for Win32 application for AQTime, you must first ensure that it includes the TD32 debug info. Follow these steps:
-
Open your project in CodeGear Delphi 2007 for Win32.
-
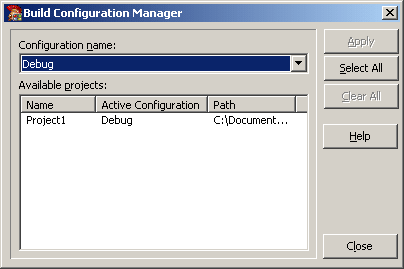
Select Project > Configuration Manager from the main menu. This will open the Build Configuration Manager dialog. Select the Debug configuration for your project:

Close the dialog.
Note: You can profile your application in any configuration, not just in the Debug one. We chose the Debug configuration to make sure the changes that will be made to compiler settings will not affect the Release configuration, which is typically used to build the final version of applications. -
Select Project > Options from the main menu. This will open the Project Options dialog.
-
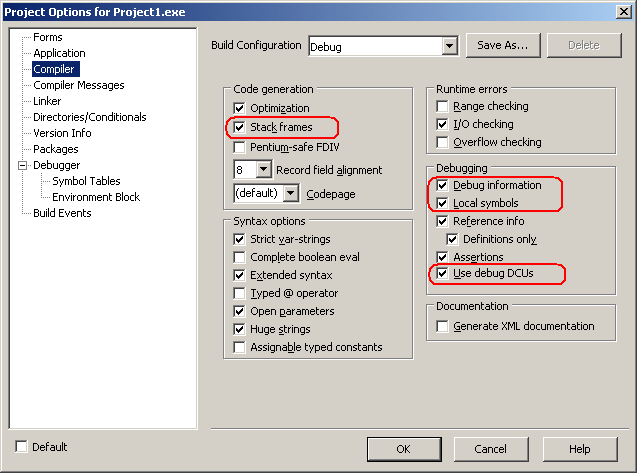
To set the compiler options, select the Compiler category from the treeview on the left of the dialog.
-
To include the symbolic debug information, in the Debugging section of the Compiler page, check Debug information.
-
To view the variables local to procedures and functions, check Local symbols.
-
If you want to profile VCL classes, for example,
TDataset, check the Use Debug DCUs box. Otherwise, AQTime will only be able to profile the classes that are defined in your application. -
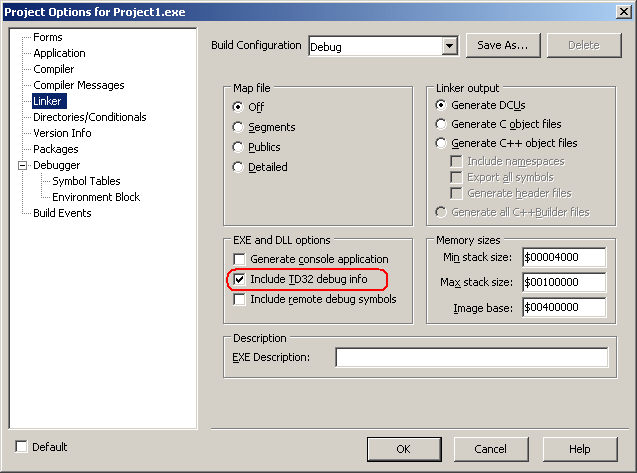
To set the linker options, select the Linker category from the treeview on the left of the dialog.
-
In the EXE and DLL options group, check Include TD32 debug info:
-
If you do not want to use the Allocation profiler, skip this step.
Note that the point of the Allocation profiler is not performance. Its point is to track memory allocations and deallocations. To do this, the profiler requires access to the basic VCL objects (
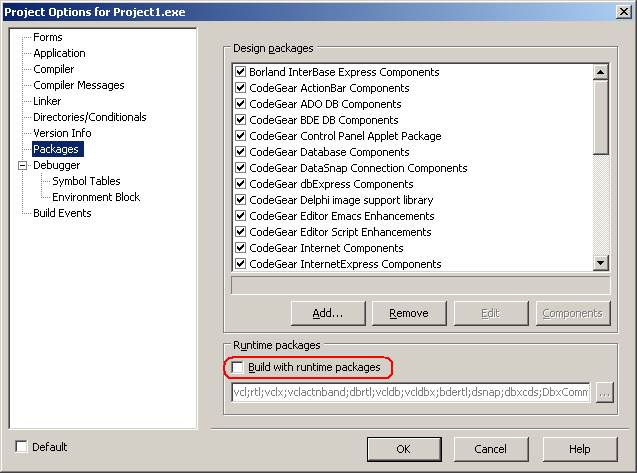
TObjectandTInterfacedObject). Therefore, the easiest way to provide this access is to uncheck the Build with runtime packages box in the Packages category:
If you want to keep Build with runtime packages (for instance, to control the exe size), you can still use the Allocation profiler. When you include your application in an AQTime project, you will also have to include the <Windows>\System32\RTL110.BPL file. To add a module to an AQTime project, press
 Add Module on the Setup toolbar or select it from the Setup context menu.
 -
Once you have set the compiler and linker options correctly, rebuild your application and it will be ready for profiling. If you are profiling an ActiveX control or a COM server however, you should register its “debug” version in the system (See Profiling COM Applications).
When your application is ready for release, remember to recompile it without debug information to reduce the application size.
| Note: | AQTime is incompatible with some third-party tools that modify the binary code of your application (for example, those that add a custom exception handling mechanism). An example of such a tool is EurekaLog. We recommend that you profile your application before processing it with such tools. |


