This topic explains how to prepare applications created with CodeGear C++Builder 2007 for AQTime. To learn how to prepare applications created with other C++Builder versions, see Compiler Settings for Native Applications.
To prepare a CodeGear C++Builder 2007 application for AQTime, you must first ensure that it includes debug info. Follow these steps:
-
Open your project in CodeGear C++Builder 2007.
-
Select Project > Options from the main menu. This will open the Project Options dialog.
-
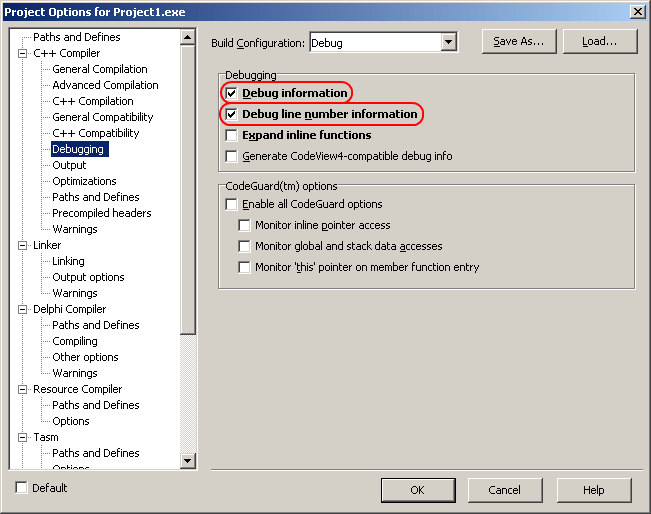
To set the C++ compiler options, select the C++ Compiler > Debugging category from the tree view on the left of the dialog.
-
To include symbolic debug information, check Debug information. In addition, to refer this information to source line numbers, check Debug line number information.
-
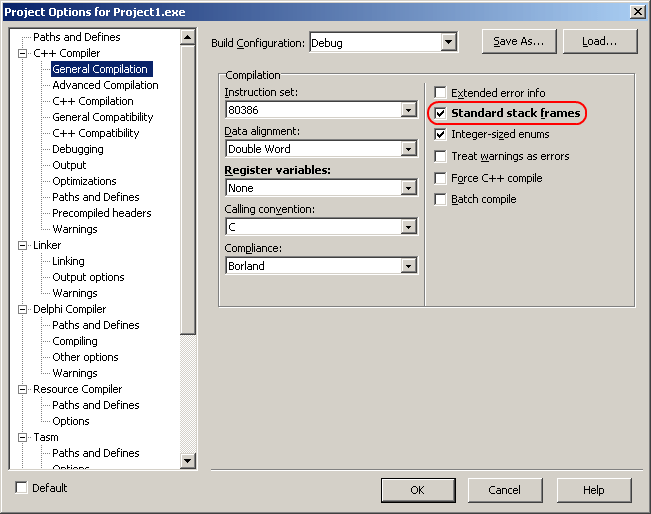
(Optional) To generate stack frames when using the C++ compiler, switch to the C++ Compiler > General Compilation category and check Standard stack frames.
-
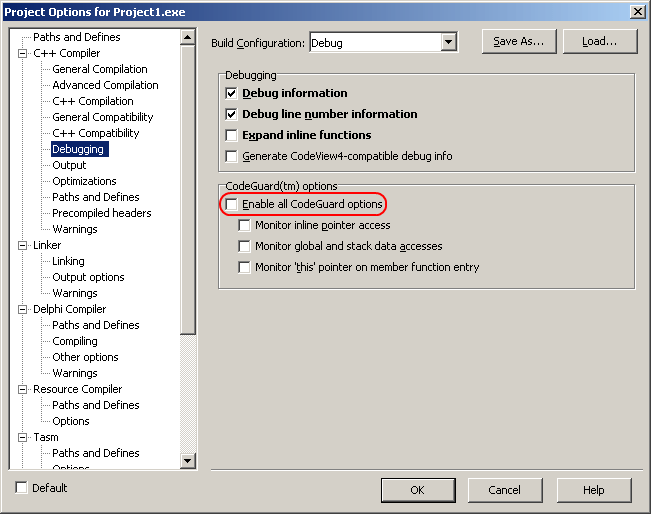
If you compile your application with CodeGuard enabled, the latter will report errors during the profiler execution. They relate to AQTime hooking code that are not actually errors. We recommend that you disable CodeGuard before profiling your application with AQTime. To do this, go back to the C++ Compiler > Debugging category and uncheck Enable all CodeGuard options.
-
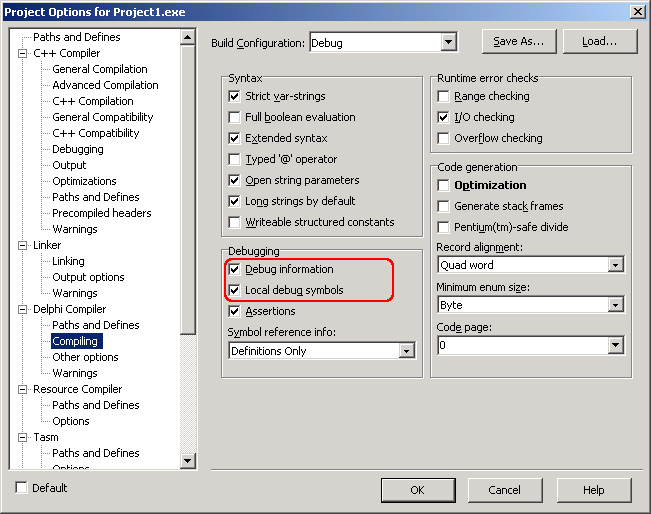
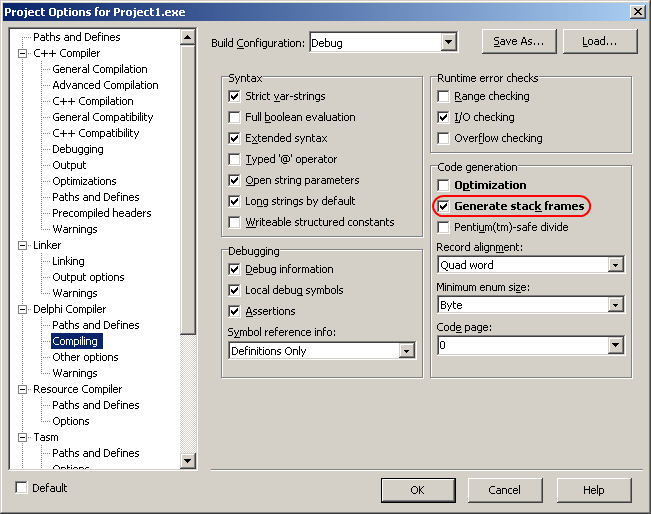
To set the Delphi compiler options, select the Delphi Compiler > Compiling category from the tree view on the left of the dialog.
-
To include symbolic debug information, check Debug information in the Delphi Compiler > Compiling category. In addition, to refer this information to source line numbers, check Local debug symbols.
-
(Optional) To generate stack frames when using the Delphi compiler, switch to the Delphi Compiler > Compiling category and check Generate stack frames.
-
To set the linker options, switch to the Linker > Linking category and check Full debug information.
-
Now, if you do not want to use the Allocation profiler, skip this step.
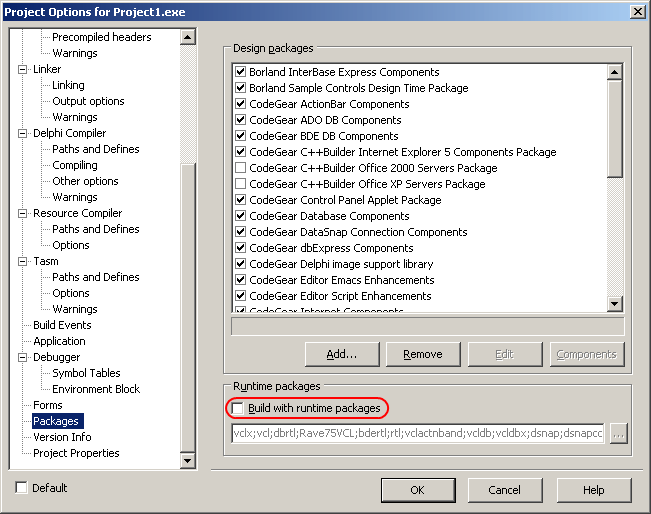
The point of the Allocation profiler is not performance. Its point is to track memory usage. If you need to have your application support the Allocation profiler, you must make sure that AQTime has access to the VCL binary code. The easiest way to add support for the Allocation profiler is to uncheck Dynamic RTL in the Linker > Linking category and then uncheck Build with runtime packages in the Packages category:

If you want to keep the Build with runtime packages option (for instance, to control the exe size), you can still use the Allocation profiler. When you include your application in an AQTime project, you will also have to include the <Windows>\System32\RTL110.BPL file. To add a module to an AQTime project, press
 Add Module on the Setup toolbar or select it from the Setup context menu.
 -
Once you have set the compiler and linker options correctly, rebuild your application and it will be ready for profiling. If you are profiling an ActiveX control or a COM server however, you should register its “debug” version in the system (See Profiling COM Applications).
When your application is ready for release, remember to recompile it without debug information to reduce the application size.
| Note: | AQTime is incompatible with some third-party tools that modify the binary code of your application (for example, those that add a custom exception handling mechanism). An example of such a tool is EurekaLog. We recommend that you profile your application before processing it with such tools. |

