There are several methods for identifying a latency problem in a particular monitoring location. Log in to your AlertSite Console and try these strategies:
-
Run the Technical Benchmark Report in order to compare your site with either more of your own sites or other high profile sites on the Internet:
-
Go to Reports > Performance Reports.
-
Choose the site or transaction in question from the dropdown.
-
Under Select, leave the radio button checked for Detail.
-
Under Include, check the box next to Technical Benchmarks.
Note: Select Report Details only if you are running a report for 24 hours or less or have long monitoring intervals (> 15 minutes), otherwise the report could not be truncated if it is more than 2500 rows. -
Select the Monitoring Location in question.
-
Select the desired Date Range.
-
In the Technical Benchmarks section (top right), choose your monitor.
-
In the Compare to your other monitored site(s) box, choose up to 7 additional sites to compare with your selected site.
-
Click Create Report.
-
-
Run a Traceroute from that particular monitoring location:
AlertSite UXM
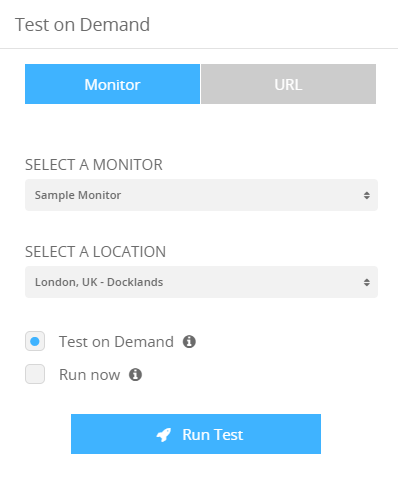
Select a Monitor
-
Click on the Dashboard toolbar.
-
Select a monitor and the location in question.
Note: You cannot run a traceroute from a DejaURL or DéjàClick Transaction. -
To run a test immediately, click the Test on Demand radio button.
-
To trigger a production test on your monitored device, click the Run now radio button.
-
Click Run test

Enter a URL
If you do not have monitors, you can enter a website address to run a test.
-
Click on the Dashboard or Edit Monitor toolbar.
-
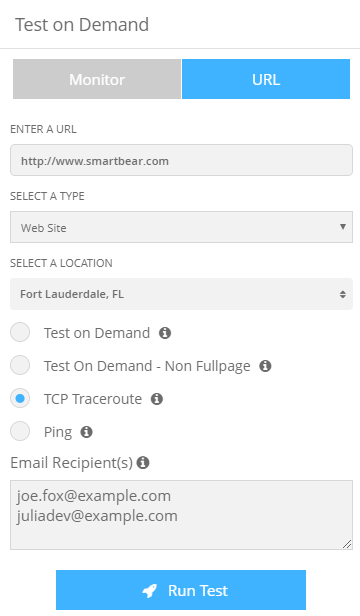
Switch to the URL tab.
-
Enter a website address in the Enter a URL field, for example, http://www.smartbear.com.
-
Select the corresponding monitor type from the Select a Type drop-down list, for example, Web Site.
-
Select the location in question.
-
Click the TCP Traceroute radio button.
-
Enter an email address where you want to send the traceroute output.
-
Click Run test.

AlertSite 1.0
-
Go to Support > Site Diagnostics.
-
Select a Site from the Test Your Device dropdown.
Note: You cannot run a traceroute from a DejaURL or DéjàClick Transaction. If you are not monitoring any sites, click the radio button next to Test Other URL and enter any website address, for example, www.google.com; the Type should be Web Site. -
In the Select Test section, select the TCP Traceroute test type.
-
Choose the Location in question.
-
Enter an email address where you want to send the traceroute output.
-
Click Submit in the upper right.
-
Check your email for the traceroute output.
-
-
Run a Test On Demand for your DejaURL or DéjàClick Transaction:
AlertSite UXM
-
Click on the Dashboard or Edit Monitor toolbar.
-
Select a DéjàClick monitor from the Select a Monitor dropdown.
If you do not have DéjàClick monitors, switch to the URL tab, enter a website address, for example, http://www.smartbear.com, and select Web Site from the drop-down list.
-
Select the location in question from the Select a Location dropdown.
-
Click the Test on Demand radio button.
-
Click Run test.
-
Examine the Detail Report (the link at the bottom center) and Fullpage Report (the blue and green horizontal bar chart in the thumbnail).
AlertSite 1.0
-
Go to Support > Site Diagnostics.
-
Select a DejaURL or DéjàClick Transaction from the Test Your Device dropdown.
-
In the Select Test section, select the Test On Demand test type.
-
Choose the Location in question.
-
Click Submit in the upper right.
-
The Test On Demand screen will appear and run your test.
-
Examine the Detail Report (link at the bottom center) and Fullpage Report (blue and green horizontal bar chart in the thumbnail).
-
-
Analyze your site's Diagnostic Details to see what IP numbers you are directed to and if there are any errors you may not be aware of:
-
Go to Reports > Performance Reports.
-
Choose the site or transaction in question from the dropdown.
-
Run a Detail Report and include Report Details.
-
Select the Monitoring Location in question.
-
Select the desired Date Range.
-
View the HTML- formatted report and select one of the measurements that is showing latency.
-
Click on the Diagnostics Icon (small multicolor bar chart) in the left column of the measurement line.
-
Analyze the report for the IP numbers we are resolving to as well as any returned error information from your server.
-
