1. Overview: what is ServerAgent
ServerAgent is the AlertSite systems monitoring agent. It resides on a Windows or Linux/Unix server, collecting system health statistics, such as CPU load and disk utilization, and reporting them back to the AlertSite monitoring service on a user-specified interval. Thresholds can be set for both warning and error conditions, providing instant notification through AlertSite notification mechanisms.
2. ServerAgent features
ServerAgent collects, reports, and alerts on system health and connectivity:
- CPU load average (5 min. average)
- Disk utilization for all logical drives
- Memory use
- Monitor for the presence of processes
- Discovery of SNMP-enabled devices
- Network interface monitoring (errors, operational Statuses, percent of utilization)
- User defined monitoring
Warning and error thresholds can be defined for any value ServerAgent is monitoring. Notifications are sent when monitored metrics breach an error threshold or the server fails to report to alertsite.com within the expected time.
 To get notified of possible connectivity loss, we recommend using connectivity alerts instead of ServerAgent.
To activate notifications for a monitored metric, the Notify and Enabled check-boxes for that metric must be enabled on the Manage Servers screen accessed by logging in to your account and selecting ServerAgents from the Configuration control menu; in the Configuration: ServerAgents screen, click on the name of ServerAgent you wish to configure.
| Tip: | It will be necessary to open the view that holds your ServerAgent. If you have not yet created a View, new ServerAgents are placed in the AlertSite default view following the first publication of collected metrics. |
Current device status is reported in the AlertSite monitoring console and historical details are available in the Report Center. Daily, weekly, and monthly email summaries are provided as well.
Configuration is centrally managed through the AlertSite Monitoring Console. To configure a single ServerAgent, or a group of ServerAgents assigned to a view, log in to your account and navigate to Configuration: ServerAgents. From there, select the particular agent or view by clicking on the link in the Name column.
2.1 Key enhancements of SeverAgent v2.x
-
Centralized Management: All features and configuration parameters are now centrally managed via the enhanced Console Manager, eliminating the need to edit configuration files directly.
-
ServerAgent Views: Agent instances may be grouped into one or more logical views to facilitate management. Configuration changes may be made against a single ServerAgent or an entire group.
-
Parallel Metrics Collection: All collection categories are gathered in parallel on a per-device basis ensuring timely and immediate identification of warning and error conditions. As each category from each resource is autonomously collected, compounded latency due to slow response times or lengthy user scripts is avoided.
-
Self-Diagnosis: The ServerAgent log files may be scheduled for email delivery for analysis and evaluation in the event of system error.
-
Data Broadcasting: Collected data may be broadcast to a list of AlertSite listeners to ensure high availability of collected data.
-
n-Tier Distributed Collection: ServerAgent instances may be configured to proxy between secondary, tertiary, or more ServerAgents. This feature provides maximum flexibility in how ServerAgent is deployed in an organization’s environment even when segments of their network do not have access to the Internet.
-
Secure Communications: All data sent over the Internet is encrypted and encoded to ensure total data protection.
-
Light Weight Processes: The ServerAgent processes require very few system resources.
-
Browser Support: The ServerAgent software accepts browser connections on default port 2525 to enable customers to view cached data pending publication.
2.2 Benefits
- Track system resource utilization
- Capture data for capacity planning
-
Fully integrated into AlertSites notification system:
- Instant notification via email, pager, SMS, and telephone
- Flexible alerting and escalation policies
- When combined with AlertSites website and Web transaction monitoring, ServerAgent can help you quickly identify and resolve system problems
2.3 Supported platforms
- Windows (2000 and above) – Cygwin (tested and verified)
-
Unix:
- Linux
- BSD
- Solaris and others (may require an up-to-date version of GCC/C++)
 |
If your platform is not listed here, contact AlertSite for information and options for having it added. |
2.4 ServerAgent status codes
There are 3 error status codes returned for problems detected by ServerAgent:
| Code | Description |
|---|---|
| 4050 | Server not responding (see Troubleshooting below). |
| 4040 | Error threshold exceeded. |
| 4030 | Warning threshold exceeded. |
3. Download ServerAgent
To download the ServerAgent software for your platform, select Downloads from the Support drop-down list of your AlertSite controls menu.
The Linux/Unix version is provided as a bash script installation package. The Windows version is the .exe installer program. Click on the download appropriate for your platform and save it to your desktop.
4. Installation instructions
If upgrading from ServerAgent 1.x (as known as Nemo), the ServerAgent v2.x installer will detect any previous installation and present you with the option to apply the Nemo settings to your new installation.
| Note: | Ensure that the Nemo Linux/Unix daemon or Win32 service appropriate for your deployment environment is not set to run automatically, as it is not advised that both collection environments run concurrently on the same system. |
4.1 Configure ServerAgent Device
| Note: | If you have a Usage Based Monitoring account, you can skip the Purchase Credits step. |
4.1.1 Purchase Credits for ServerAgent
If you have a standard account and have not purchased a credit for your ServerAgent device, follow the procedure below:
-
Log in to the AlertSite console.
-
From the Account drop-down list in the controls menu, select Purchase Credits.
-
Click Systems Monitoring Agent in the Service column.
-
Select the desired plan:
- Systems Monitoring (5 minute reporting interval)*
- Systems Monitoring (15 minute reporting interval)**
-
Enter the number of credits to purchase in the field under the Additional Purchase column and click Submit.
-
Click Submit again to confirm purchase.
* A 5-minute ServerAgent plan can be configured for reporting intervals every 5, 6, 10, 15, 20, 30, 60, and 120 minutes.
** A 15-minute ServerAgent plan can be configured for reporting intervals every 15, 20, 30, 60, and 120 minutes.
4.1.2 Add ServerAgent Device
To add a new ServerAgent device in the AlertSite console, perform the following steps:
-
In the Configuration drop-down list in the controls menu, select ServerAgents.
-
In the Configuration: ServerAgents screen, click Add a New ServerAgent button. This produces:
-
Complete the form:
-
Provide a site name in the Site Name field.
-
Select the site plan from the Site Plan drop-down list*.
-
Adjust the reporting interval in the Reporting Interval drop-down list to match the site plan.
-
Click Submit.
-
* If you are a Usage-Based Monitoring customer, configure ServerAgent by selecting Usage Based Pricing from the Site Plan drop-down list (see below) and configure the Reporting Interval to 1, 2, 3, 4, 5, 6, 10, 15, 20, 30, 60, or 120 minutes.
| Note: | Intervals below 5 minutes are not recommended if you are monitoring several items (processes, CPU elements, and so on), as it does put a load on the system. |
This will generate the 32-character Device ID needed during the installation. Save this ID in a convenient place:
4.2 Installation Instructions for Microsoft Windows
Installation directory: C:\Program Files\AlertSite\ServerAgent.
If upgrading to a new version of ServerAgent, you must uninstall the existing version:
-
Stop ServerAgent:
-
Go to Start > Services from the taskbar.
-
Click AlertSite ServerAgent Manager and then click Stop to stop the service.
-
Click on AlertSite ServerAgent Monitor and then click Stop to stop the service.
-
Close Services window.
-
-
Go to Control Panel > Programs > Uninstall to uninstall a program.
-
Select ServerAgent and follow the prompts for Automatic method for removing the program.
Installation process:
-
From the Support drop-down in the controls menu of your AlertSite console, select Downloads and download the ServerAgent installation package, ServerAgentInstaller.exe, to your desktop by clicking on the ServerAgent v2.x for Windows link.
-
Run the downloaded installer. This will place the ServerAgent package in C:\Program Files\AlertSite\ServerAgent.
-
During installation, you will be prompted for the 32-characters Device ID generated in the previous section. Enter that value and click Next.
| Note: | A system restart is required for Windows Vista/2003, 2008 Server, or Windows 7. If running Win XP (SP2) or lower, when prompted to restart your system, you may click Cancel. |
This completes the Microsoft Windows installation. In a few minutes, you should see information related to your server device displayed on the AlertSite console.
4.3 Installation for Linux/Unix/Cygwin
Installation directory: /usr/local/alertsite.
-
From the Support drop-down list in the controls menu, select Downloads and download the ServerAgent Installation package (server-agent-installer.sh) to your desktop by clicking on the ServerAgent v2.x for Linux/Unix link.
-
In a terminal window, login as root, change to the directory where you downloaded the installation package and execute the following command:
# sh ./server-agent-installer.sh
-
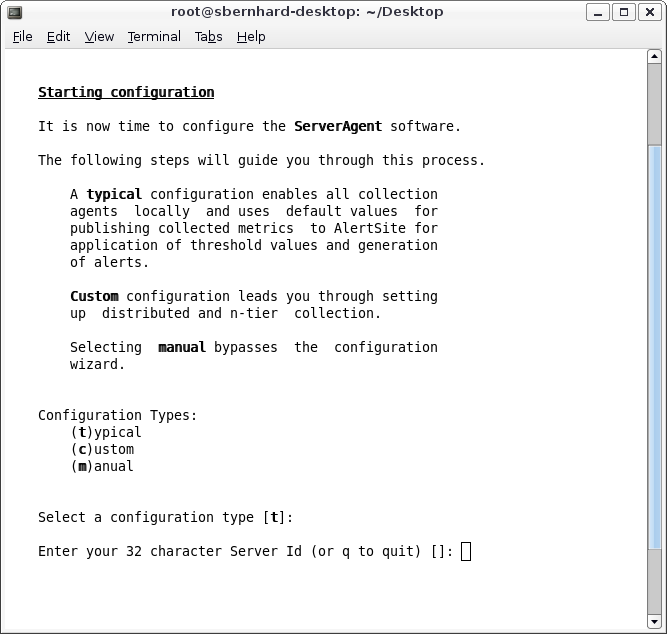
During installation, you will be prompted for the 32-character Device ID generated in the previous section. Copy and paste the Device ID from the console to the Device ID prompt response and press Enter.

If you are trying to install ServerAgent on a Linux server such as Suse or Redhat, you can get the following error: The ServerAgent software may not be compatible with your compiler and/or hardware.
This indicates that the ServerAgent installer is looking for g++ libraries on the system, and they are not available. Please install the g++ libraries for the installation to complete. -
The installation provides the /usr/local/alertsite/init.d/server-agent scrip used for starting and stopping the ServerAgent daemons (/usr/local/alertsite/bin/commgr and /usr/local/alertsite/bin/agentmgr). Move the server-agent script to the appropriate run command directory for your system, for example, /etc/init.d.
# cp /usr/local/alertsite/init.d/server-agent /etc/init.d
-
Start the ServerAgent daemon for ServerAgent with the following command:
# /etc/init.d/server-agent start
-
Verify that the daemons are running by executing the following command:
# ps -ef | grep mgr
You should see:
# ps -ef | grep mgr
root 5613 1 2 Oct22 ? 00:35:15 /usr/local/alertsite/bin/commgr
root 5631 1 1 Oct22 ? 00:21:35 /usr/local/alertsite/bin/agentmgr
This completes the Linux/Unix/Cygwin installation. In a few minutes, you should see information related to your server device displayed on the AlertSite console.
5. Configure a ServerAgent device in the console
From the Configuration drop-down list in the controls menu on the AlertSite console, select ServerAgents to bring up the Configuration: ServerAgents screen, then click on the name of ServerAgent you wish to configure.
5.1 ServerAgent Views
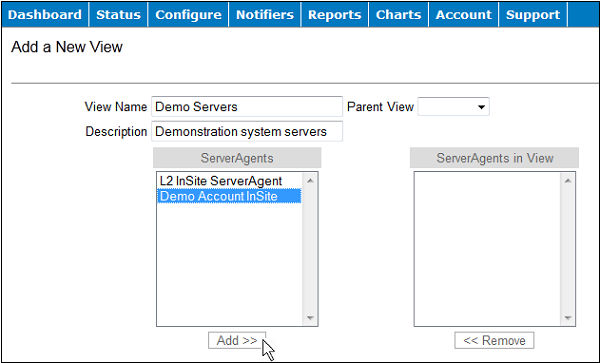
If you have multiple ServerAgents, they can be grouped in views for more controlled monitoring. For example, you can group ServerAgents monitoring systems in IT in one view and ServerAgents monitoring machines in Accounting in another view. To create a view, select ServerAgent from the Configuration drop-down list in the controls menu, and click Add a View:
The Add a View page displays a ServerAgent selection box with the names of ServerAgents configure in the account. To move ServerAgent into the selected view, highlight the name (press Ctrl and click to select multiple names), and click Add:
The names will appear in the ServerAgents in View box. Click Submit to save the changes. The Configuration: ServerAgents screen will display the view name. Click + to the left of the name to display ServerAgent(s) listed in the view:
5.2 ServerAgent Configuration
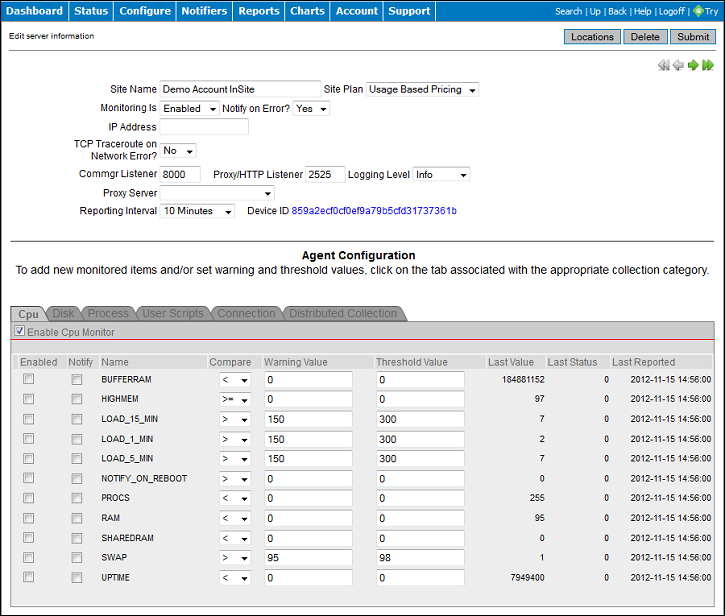
There are two main sections of the Manage Servers page. The top portion is the Server Information section describing the device and contains monitoring selection criteria. The bottom section, Agent Configuration, is comprised of a set of tabs – CPU, Disk, Process, User Scripts, Connection, and Distributed Collection – where the data thresholds and process information are configured. The Manage Servers page, displayed by clicking on the ServerAgent name in Configuration: ServerAgents, appears as follows:
| Note: | The Agent Configuration section takes some time to populate with the tabs after initial installation. Allow 15-20 minutes for the screen to update. Refresh the browser to check. |
After the Agent Configuration section has been populated, you may then select individual metrics in the CPU, Disk, Process, User Scripts, and Connection tabs for which to establish thresholds. The Thresholds Available column of the Configuration: ServerAgents screen will display No for ServerAgent devices with no thresholds configured, Yes if you have established any thresholds.
5.2.1 Server Information Section
The upper portion of the Manage Servers page contains a set of fields that describe the common elements of ServerAgent, some of which were completed when the device was added as previously described. The table below describes these fields:
| Configuration Parameter | Description |
|---|---|
| Site Name |
The ServerAgent device’s name. This can be a short URL or a brief description of the server you are monitoring – for example, Acme Widget Company Email Server.
|
| Site Plan | The monitoring plan purchased in your AlertSite account. |
| Monitoring is | Dropdown value: Enabled or Disabled. Sets the monitoring state for this device. |
| Notify on Error? | Dropdown values: Yes or No. Turns alert notification on or off for this device. |
| IP Address | The IP address of the monitored device. If the server you are monitoring does not have a DNS name then this field must be completed manually. Also, please provide this value if ServerAgent will perform proxy services for other ServerAgents. |
| TCP Traceroute on network error | Select Yes and AlertSite will conduct a TCP traceroute and send a notice to all email alert recipients when we issue an alert for a network connectivity issue. A traceroute prints the route packets take to reach a host and is used by administrators and engineers in fault diagnosis. |
| Use Ping to verify network errors | Ping is a low-level test to determine if your server is reachable. Select Yes if your server allows pinging. Select No if pinging is blocked. |
| Commgr Listener | Port where the Communication Manager (Commgr) listens for agent registration and collects metric publication. |
| Proxy/HTTP Listener | Port where Commgr will listen for Proxy requests from other ServerAgent instances during distributed collection. Also accepts connections from supported browsers to enable the user to view the contents of the collected metrics cache between publication intervals. |
| Logging Level | Assigns the level of verbosity with which ServerAgent will log messages. |
| Proxy Server | By default, ServerAgent publishes directly to an AlertSite server; however, if this ServerAgent does not have visibility to the Internet, it may be necessary for ServerAgent to employ another ServerAgent as a proxy. The proxy ServerAgent is assigned here. Ensure that the IP Address of ServerAgent selected as a proxy server is specified. |
| Reporting Interval | Determines the frequency of monitoring. |
| Device ID | The device ID generated by AlertSite to uniquely identify the monitored device. This value is required during installation. |
It is occasionally required to modify the listener ports employed by ServerAgent. The following table describes the configuration options and default values for the ports used by ServerAgent.
| Configuration Parameter | Port | Description |
|---|---|---|
| Commgr Listener | 8000 | Monitored by the communication manager process to accept collected metrics from the agents for publication to AlertSite. |
| Proxy/HTTP Listener | 2525 | Used when ServerAgent is configured as a proxy in a distributed or n-Tier deployment. Also accepts HTTP GET requests for users wanting to monitor the collected data pending publication. |
5.2.2 Agent Configuration Section
The lower portion of the Manage Servers page provides a means of configuring specific settings for each collection agent, separated into tabs:
The Enable check box found below the category tab name enables monitoring of the selected metrics by ServerAgent. Each collection agent also has a checkbox to enable specific settings and alert notification.
The following sections illustrate the settings for the each collection agent. See 9. Description of Errors below for more information.
5.2.2.1 CPU
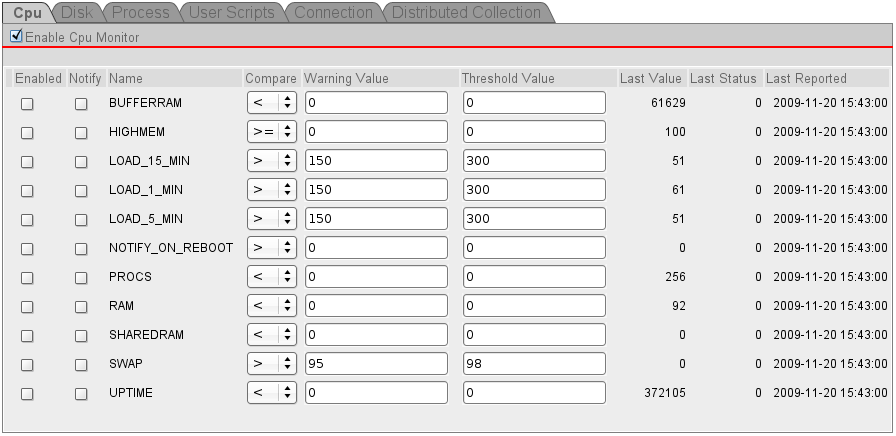
The metrics collected by the CPU agent are determined by the operating system where ServerAgent is running. Therefore, the only settings that the user may affect are the Warning and Threshold values:
-
Linux/Unix:
-
Windows:
5.2.2.2 Disk
As with the CPU monitor, the metrics collected by the disk agent are determined by your system. Therefore, the only settings that the user may affect are those for Warning and Threshold values:
-
Linux/Unix:
-
Windows:
5.2.2.3 Process
You can monitor specific processes, for example, the syslog daemon or print spooler, and configure ServerAgent to notify you if the process has stopped running. The initial screen appears as follows:
You can add more processes to the list by clicking + on the right side of the window under Last Reported. To determine the appropriate value to enter in the Name field for process monitoring, use the following methods:
-
Windows:
-
View the Task Manager by pressing Ctrl+Alt+Delete and selecting Task Manager.
-
On the Process tab of the Task Manager, find the name of the application under the Image Name column. This is the explicit value to enter in the Name field of the Process configuration tab.
-
-
Linux/Unix:
Execute the
pscommand for your Linux/Unix distributive to determine the appropriate process name to enter in the Name field of the Process configuration tab. For example, to see a list of all command in a standard Linux system, execute the following command:$ ps -e -o comm
Select the process names from the output listed.
For illustration, here is the process agent populated with two processes to monitor, syslogd and sshd:
| Note: | The Enable Process Monitor, Enabled, and Notify check boxes have all been checked. This enables monitoring of both processes and will alert all assigned notifiers if either of these processes is no longer detected (Threshold value < 1). |
5.2.2.4 User Scripts
The ServerAgent software considers the presence of user scripts staged by the user to perform monitoring functions beyond the categories offered by ServerAgent. Details of the user script functionality and supported configuration options may be found under the section Monitoring User-Defined Scripts found later in this document.
5.2.2.5 Connection
The Connection monitor enables a user to monitor specific network services running on a designated host. The syntax for adding a new connection to monitor is host:port, for example:
Values returned by the network monitor are 0 or 1 for failed to connect and connect success, respectively.
5.2.2.6 Distributed Collection
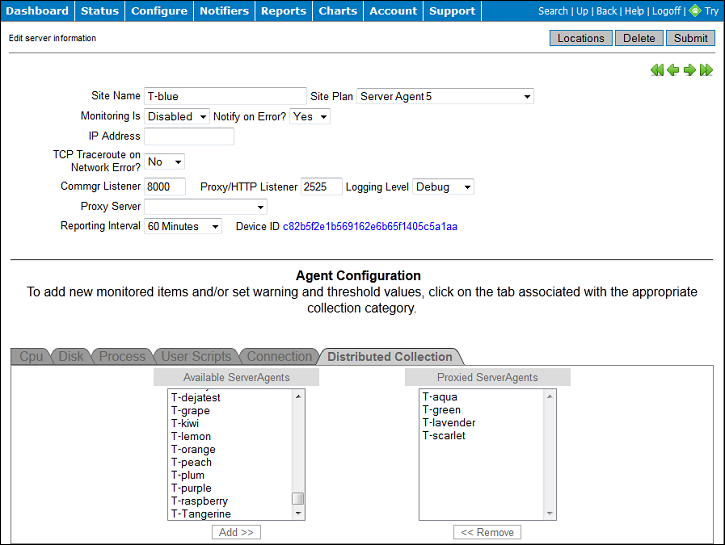
The ServerAgent software may be instructed to proxy for other ServerAgents that do not have visibility to the public Internet. The Distributed Collection tab provides a means of specifying which ServerAgents will be subordinate to this ServerAgent. In the example below, ServerAgent T-blue will be the proxy server for T-aqua, T-green, T-lavender, and T-scarlet:
Click on the ServerAgent name in the Available ServerAgents box to select ServerAgent to act as proxy for the current ServerAgent and click Add. The selected ServerAgent will appear in the Proxied ServerAgents box. Select multiple ServerAgents by pressing Ctrl and clicking.
| Note: | This is valid only for accounts with two or more ServerAgents configured. |
5.3 Monitor User-Defined Scripts
ServerAgent can monitor processes, CPU, and basic disk utilization natively. Many customers, however, want to integrate resource- or environment-specific monitoring with ServerAgent. This can be done by adding user-defined monitoring scripts to ServerAgent.
Almost any executable script, .cmd file or program that outputs a single integral value to standard out can be integrated into ServerAgent.
5.3.1 How It Works
ServerAgent will scan for any user scripts both at startup and during run-time. For any scripts found, ServerAgent will attempt to run them on each monitoring pass (typically every minute).
It will read the first line of output generated by the script, expecting an integral value, and use that value to test for error or warning conditions configured in your AlertSite account.
Any other text produced by the script will be saved as additional information for your own use. For example, if you have a script that searched for error conditions in your system log files, you could add the actual error messages as output to the script after the numeric value used to indicate the error/warning condition.
5.3.2 Install Scripts
-
Windows:
Place the script in C:\Program Files\AlertSite\ServerAgent\user. If this folder does not exist, create it.
Note: It is not necessary to stop and restart the ServerAgent service. -
Linux/Unix:
Place the script in /usr/local/alertsite/bin/user.
Note: It is not necessary to kill and restart the ServerAgent process. Any changes to the bin/user directory will be immediately detected and acted upon.
5.3.3 Sample Scripts
-
Sample Windows testfile.cmd file that checks for the presence of a file:
@ECHO OFF
IF EXIST c:\tmp.txt (
echo 1
echo File Found
) ELSE (
echo 0
echo File Not Found
)Note: If using a .bat or .cmd file and echo is used to generate output for ServerAgent, be sure to provide the @character prior toECHO KEYWORD. -
Sample Unix chkfile.sh shell script that checks for the presence of a file:
#!/bin/sh
# returns "1" if a file exists
if [ -f /tmp/somefile.txt ]
then
echo "1"
echo "File Found"
fi
5.3.4 Limit User Scripts
Under normal conditions, ServerAgent on your machine will run your user scripts approximately once per minute. Data is sent to AlertSite based on your ServerAgent plan, usually at 5- or 15-minute intervals, or as often as once a minute for Usage Based Monitoring accounts. However, if an error threshold is raised on your machine, the error condition is transmitted immediately to AlertSite so you can be notified. After an error has been reported, no more data is sent to AlertSite until the next monitoring interval.
There could be reasons why you want to limit how often a particular script runs on your machine, including:
-
It is very CPU intensive and you would like to use it less often.
-
It monitors data that does not change very often, such as making sure a daily transaction occurred.
-
You want to make sure every transaction is captured by the AlertSite system for reporting purposes. In this case, you would want to run the script only on your particular monitoring interval to make sure all the data is transmitted to AlertSite.
For all the above cases, you can add a limit to the ServerAgent configuration by adding an Interval Limit, format :<N>, where N is the run interval, to the name of the user script.
For example, consider that you have a 5-minute ServerAgent collection interval and want to limit the shell script http_stat.sh to run only on the actual 5-minute interval. You also have a Perl script, db_check.pl, that you want to run once per hour (that is, every 12th interval).
To do this, add the script names with the appended interval limit in the Name field, then select the Compare type, Warning Value and Threshold Value, check Enabled and Notify as required, then submit the changes by clicking Submit in the upper right of the page. To illustrate:
| Note: | Once the information has been saved, it will be necessary to delete and re-add the script in order to add or modify the :<N> value. Any other configured scripts without :<N> will be run on the standard once-a-minute schedule. |
6. ServerAgent-to-AlertSite communications
The client software opens an outgoing socket to our server on port 4892. Both the client side check-in packet and the server side response are encrypted and encoded ASCII packets. If you are monitoring a private location with ServerAgent, the firewall setting for TCP outbound port 4892 has to be open.
Here is a sample from one of our servers, decoded and unencrypted:
-
Incoming from client:
<REPORT><Function>MONITOR</Function><ServerID>8f2264198cb88f896c88fe15182ebbd4</ServerID>
<ClientVersion>2.0</ClientVersion><Hostname>serveragent</Hostname><DISK_INFO>
<DRIVE_root_BLOCKS>8</DRIVE_root_BLOCKS><DRIVE_dev_shm_BLOCKS>0</DRIVE_dev_shm_BLOCKS></DISK_INFO>
<PROCESS><httpd>0</httpd><bash>2</bash><sshd>7</sshd><ftpd>0</ftpd></PROCESS><CPU_USAGE>
<LOAD_1_MIN>0</LOAD_1_MIN><LOAD_5_MIN>0</LOAD_5_MIN><LOAD_15_MIN>0</LOAD_15_MIN>
<PROCS>61</PROCS><UPTIME>2220055</UPTIME><RAM>57</RAM><SWAP>0</SWAP>
<NOTIFY_ON_REBOOT>0</NOTIFY_ON_REBOOT></CPU_USAGE></Report> -
Outgoing from server:
<Response><TIME>1211373241</TIME><SEED>4</SEED><STATUS>0</STATUS><LogLevel>info</LogLevel>
<ServerList>blue.acme.com:4882,green.acme.com:4882</ServerList><Thresholds>THRESHOLDS=0</Thresholds>
<VERSION>2.0</VERSION><INTERVAL>5</INTERVAL></Response>This is a typical handshake between the ServerAgent and the AlertSite server.
7. Log files
ServerAgent currently keeps a 7-day rolling history of log files.
Naming convention: server-agent.YYYYMMDD.
Location:
-
Windows:
c:\Program Files\ServerAgent\logs
-
Unix:
/usr/local/alertsite/bin/logs/
Successfully functioning ServerAgent will have entries in the log file that show its present configuration:
02/24/2008@11:57:07 (info ) agentmgr -- starting cpu metrics collector
02/24/2008@11:57:08 (info ) agentmgr -- starting disk metrics collector
02/24/2008@11:57:08 (info ) agentmgr -- starting task metrics collector
02/24/2008@11:57:08 (info ) agentmgr -- starting network metrics collector
02/24/2008@11:57:08 (info ) agentmgr -- starting user metrics collector
8. Troubleshooting
8.1 Ensure the service or daemon is running
Under Linux/Unix, a simple ps (process status) command will reveal if the daemons are running as seen in the following example:
$ ps -ea | grep mgr
– or –
$ ps ax | grep mgr
8.2 Ensure the Commgr and Agentmgr processes are in output
Under Windows, go to Control Panel > Administrative Tools and double-click on Services. It may be necessary to expand the Name column to view the full text of the service names. In the list, find AlertSite ServerAgent Manager v2.x and AlertSite ServerAgent Monitor v2.x and ensure their status is shown as Started.
8.3 Verify connectivity to assigned monitoring server
If ServerAgent cannot connect to its assigned monitoring server, error messages will be displayed in the log files that look like this:
01/31/2008@09:11:14 (info ) agentmgr -- waiting for collector (localhost:8000)
01/31/2008@09:11:14 (error ) commgr -- failed to connect to myserver.acme.com:4892 (connection refused): will retry 1 more times
Check if the server running ServerAgent has outbound connectivity to the appropriate AlertSite monitoring location. To verify that there is appropriate connectivity:
# telnet myserver.acme.com 4892
A connection should be established, and upon hitting Enter, the connection closed by foreign host should be displayed.
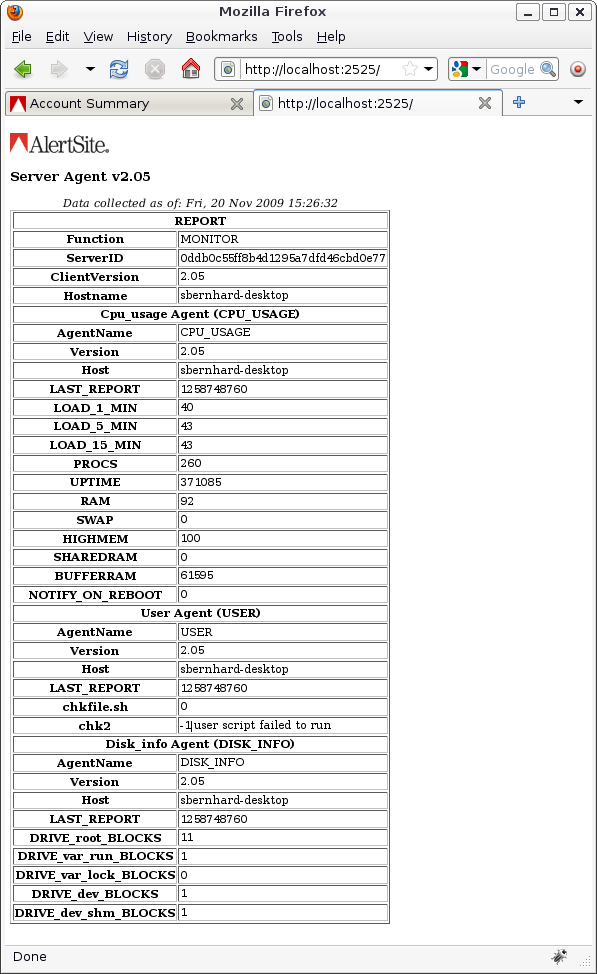
Also, the communication manager will accept browser connection to its default listener port (2525). Point your browser to where ServerAgent is running, for example, http://localhost:2525 and you will be able to view the data pending publication as displayed in the example below:
8.4 Debugging
ServerAgent can be configured to add debugging information to your log files for network problems. Review the earlier section in this document regarding configuring a ServerAgent.
Logging Level – Assigns the level of verbosity with which ServerAgent will log messages.
Any time ServerAgent cannot talk to AlertSite, it will perform a ping and a traceroute for the particular monitoring server and include that information in the log file. Please note that this requires the following commands to be included in the program path of ServerAgent:
-
Windows:
pingandtracert -
Linux/Unix:
pingandtraceroute
9. Description of metrics
| ServerAgent Linux/Unix Metrics | ||
|---|---|---|
| CPU_USAGE | BUFFERRAM | Memory used by buffers. |
| CPU_USAGE | HIGHMEM | High memory space used by kernel. |
| CPU_USAGE | LOAD_15_MIN* | Active tasks averaged over prior 15 minutes (value shown is load average x 100). |
| CPU_USAGE | LOAD_1_MIN* | Active tasks averaged over prior 1 minute (value shown is load average x 100). |
| CPU_USAGE | LOAD_5_MIN* | Active tasks averaged over prior 5 minutes (value shown is load average x 100). |
| CPU_USAGE | NOTIFY_ON_REBOOT | Date and time when rebooting, otherwise 0. |
| CPU_USAGE | PROCS | Number of running processes. |
| CPU_USAGE | RAM | Percent of used main memory size. |
| CPU_USAGE | SHAREDRAM | Amount of shared memory. |
| CPU_USAGE | SWAP | Percent of used swap space. |
| CPU_USAGE | UPTIME | Seconds since last reboot. |
| DISK_INFO | DRIVE_name_BLOCKS | Percent of used disk blocks for drive name. |
| PROCESS | taskname |
Number of times process taskname is running now.
|
| USER | userprogram |
Results of your userprogram.
|
* Load average is the average number of active tasks that are either running or waiting for I/O. See utime(1).
| Note: | Not all metrics are available on all Linux/Unix operating systems. |
| ServerAgent Windows Metrics | ||
|---|---|---|
| CPU_USAGE | LOAD_AVERAGE | Percent of CPU usage. |
| CPU_USAGE | MEMORY_LOAD | Special value, provided by operating system, between 0 and 100 that gives a general idea of current memory utilization, in which 0 indicates no memory use and 100 indicates full memory use. |
| CPU_USAGE | NOTIFY_ON_REBOOT | Date and time when rebooting, otherwise 0. |
| CPU_USAGE | PAGING_MEMORY_USAGE | Percent of using paging file on disk. |
| CPU_USAGE | PHYSICAL_MEMORY_USAGE | Percent of total physical memory used. |
| CPU_USAGE | PROCS | Number of processes currently running. |
| CPU_USAGE | VIRTUAL_MEMORY_USAGE | Percent of the virtual memory used. |
| DISK_INFO | DRIVE_letter_USAGE | Percent of the fixed letter disk used. |
| PROCESS | taskname |
Number of times process taskname is running now.
|
| USER | userprogram |
Results of your userprogram.
|


