BitBar is a flexible cloud-based platform for mobile app testing that allows you to perform automated testing in any framework or manual app testing against real iOS and Android devices. AlertSite integrates with BitBar allowing you to schedule and monitor test runs on real devices. This way you can continuously monitor key transactions on mobile devices and get proactively notified of any availability or performance issues.
How AlertSite and BitBar work together
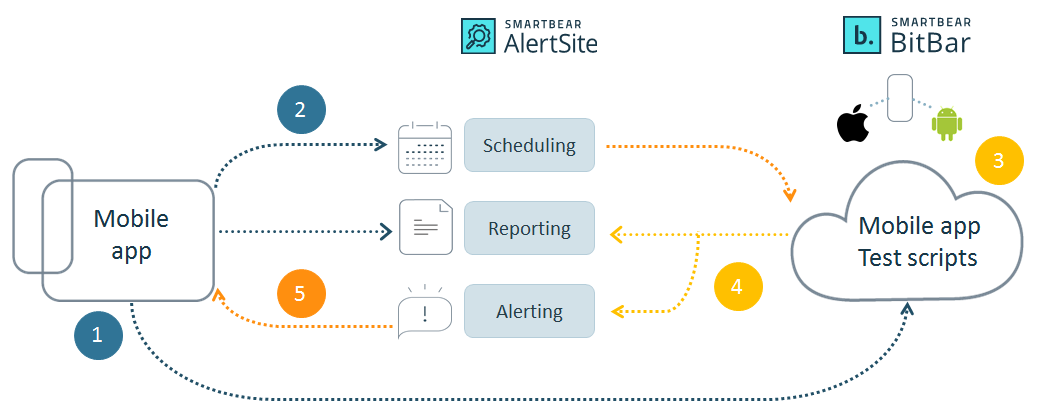
BitBar provides automated testing capabilities and real devices for monitoring, and AlertSite provides scheduling, alerting, and reporting. The following image shows the integration flow between the two systems.
-
A user uploads an app and creates tests in BitBar.
-
A user schedules tests in AlertSite.
-
Tests run on real devices in BitBar.
-
Test results are sent to AlertSite.
-
AlertSite sends alerts if a test fails. A user can also view test reports online in AlertSite.
Requirements
-
Mobile monitoring plan in your AlertSite account.
-
Trial or active BitBar account with at least 2 dedicated devices.
-
Working BitBar project with successful runs using either the Monitoring Trial iOS or Monitoring Trial Android device group.
Configure BitBar
BitBar allows you to use any framework to run automated tests on thousands of real devices for your mobile app. To create an automated test in BitBar:
-
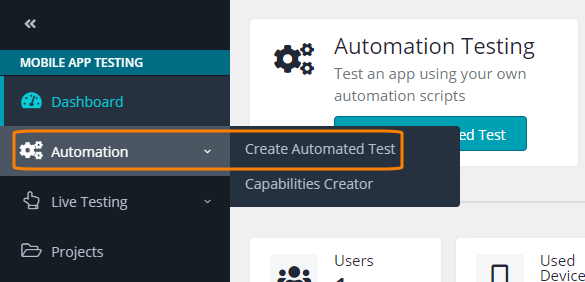
On the Dashboard, click Create Automated Test in the Automation Testing widget.
-- or --
Select Automation > Create Automated Test on the left sidebar.
-
Select the target operating system in the Select a target OS type step:
-
iOS – Select for testing iOS applications.
-
Android – Select for testing Android applications.
-
Desktop – Select for browser testing.
Note: In this tutorial, we will use an iOS application for demonstration purposes. -
-
Depending on the selected operating system, select one of the available frameworks in the Select a framework step. Currently, the supported frameworks are:
iOS
-
Appium iOS Server Side
-
XCTest
-
XCUITest
-
Mobile Browser Testing
Android
-
Android Instrumentation
-
Appium Android Server Side
-
Mobile Browser Testing
Note: Depending on your cloud setup, the names and available frameworks may differ from the ones listed above. -
-
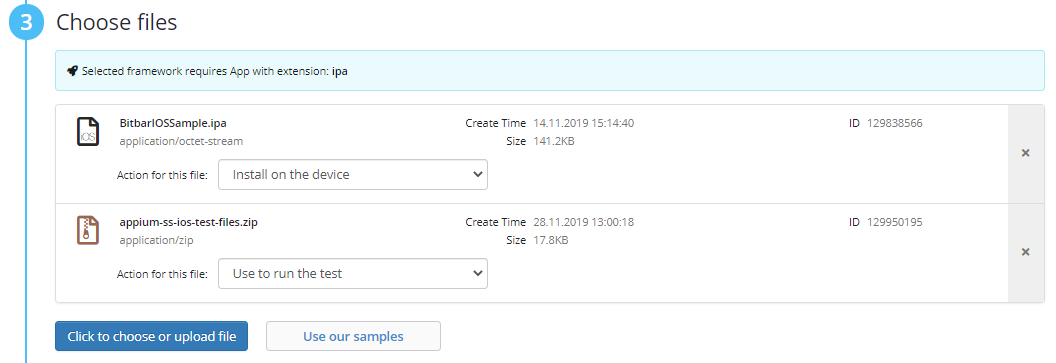
Upload your application file in the Choose files step. You can upload up to 3 files.
Tip: If you do not have a test app file yet, click Use our samples to upload sample apps. Select what action to perform over the uploaded files:
-
Install on the device
-
Copy to the device storage
-
Use to run the test
-
-
Select a device or a device group in the Choose devices step:
-
Use existing device group – Select this option if you want to use trial devices or have an existing device group.
-
Use chosen devices – Select this option if you want to choose devices from the list of available devices.
-
Run on currently idle devices – Select this option if you want to run your test on random devices that are not currently used.
Note: We recommend that you use dedicated devices included in your BitBar plan. -
-
Click Create and run automated test.
In addition to the basic settings described above, there are plenty of additional configuration options for the test run, such as project and test run names, test case options, scheduling, custom test run parameters, and so on. For details, see Advanced settings.
Copy test run configurations
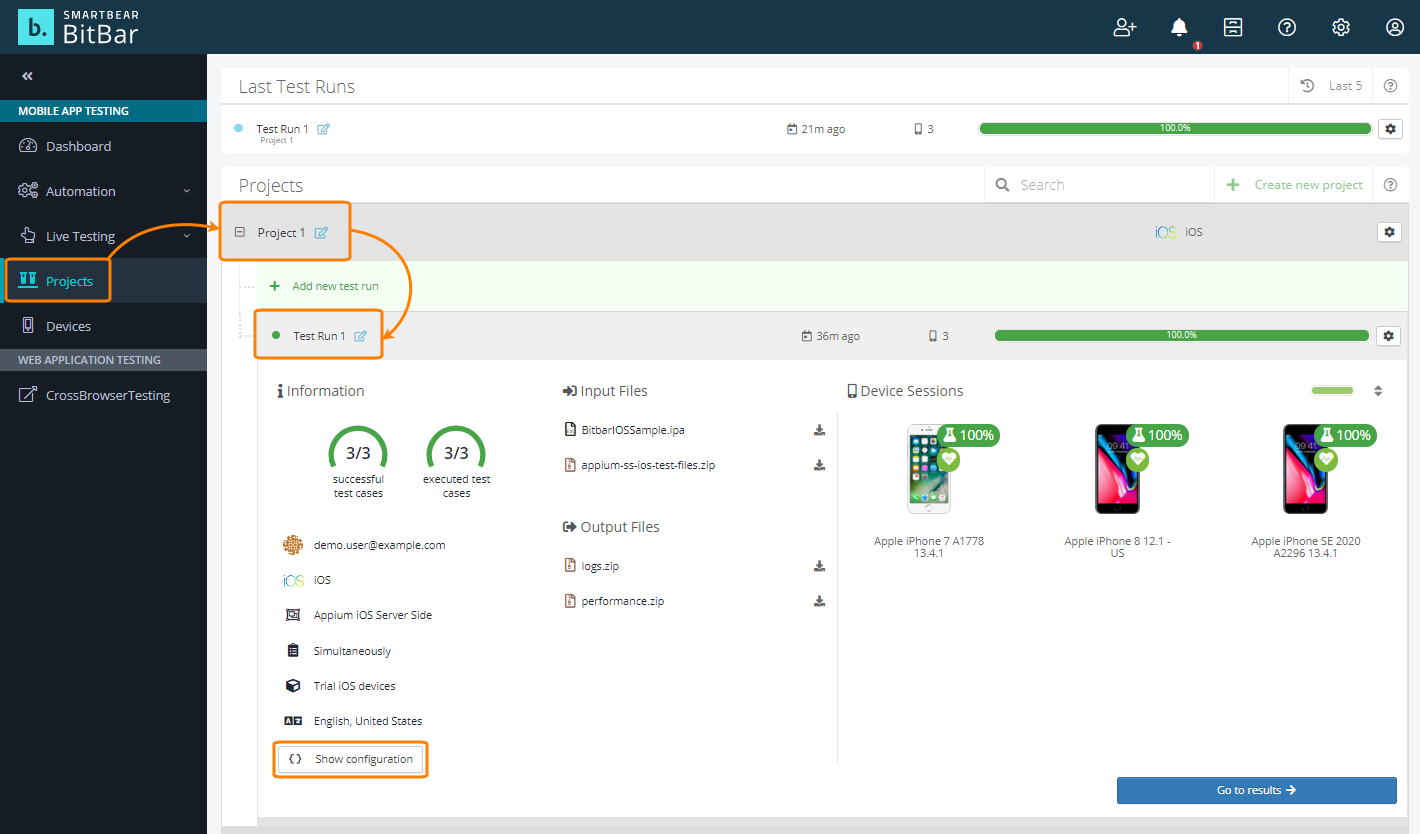
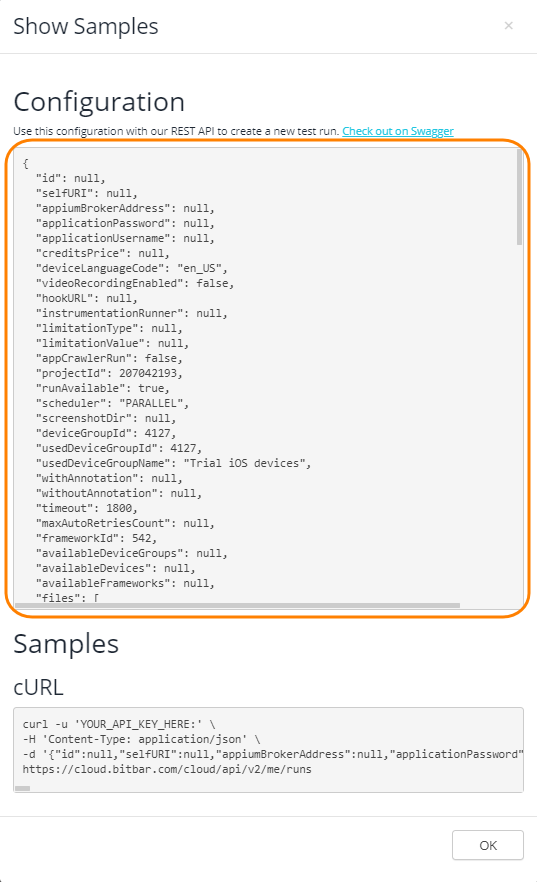
Once the test run is created and it finished running, copy the test run configuration to use it later in AlertSite monitor configurations.
To copy the test run configuration in BitBar:
-
In the Projects panel, expand your project and test run and click Show configuration.
-
Copy the test run configuration.
Use AlertSite
Create AlertSite monitors from BitBar tests
-
On the AlertSite Dashboard, hover over + Add New and select Monitor.
-
Select Mobile and click Real Device Testing.
-
Specify basic monitor information:
-
Monitor Name – Enter the monitor name.
-
Choose Measurement Plan – Select your mobile monitoring plan.
-
Run Interval (Minutes) – Select how often the monitor runs.
-
-
Specify your BitBar account details and test run configuration:
-
API Key – Enter your BitBar API key.
-
Hostname – The hostname should be cloud.bitbar.com.
-
Run Configuration – Paste the copied BitBar test run configuration.
-
-
Click Start Monitoring Now.
Note: This completes basic monitor configuration, but the monitor does not actually run yet. -
Make sure monitoring is enabled. Select the Enabled check box on the Main tab of the monitor settings.
-
Click Save to save the monitor configuration.
AlertSite will now run the specified test run in BitBar according to the schedule and collect the results.
Set Up Alerts
AlertSite can send automated alerts when your mobile transactions fail, or the response time exceeds the configured limit. You need to enable alerts in the monitor settings and configure the alert recipients.
To enable alerts for a monitor:
-
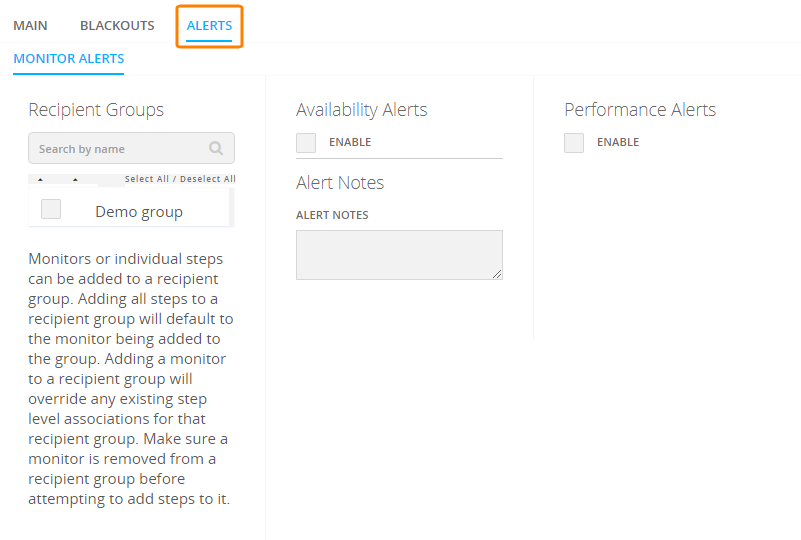
Open the monitor settings. To do this, click on the monitor tile on the Dashboard and select Edit Configurations.
-
Switch to the Alerts tab.
-
Select which alert types the monitor will send:
Availability alerts – Sent on an error condition.
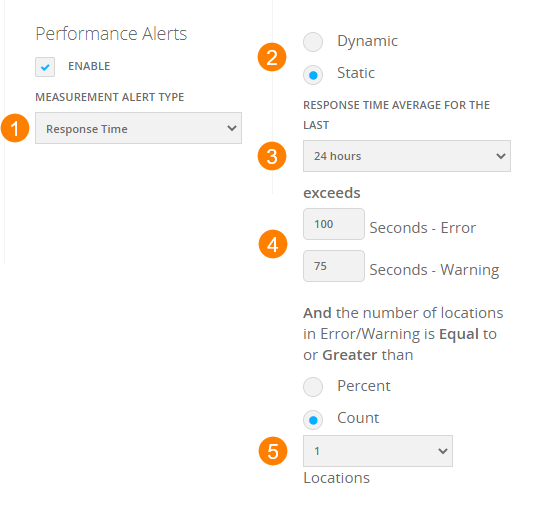
Performance alerts – Sent when the response time exceeds a threshold. You can set thresholds for the entire script or individual transactions.
To configure the threshold:
-
Set Measurement Alert Type to Response Time.
-
Select the threshold type – Static (a fixed value) or Dynamic (compared to the historical performance).
-
Select the time period for analysis. Use a larger period to look for trends rather than single events.
-
Enter the error and warning thresholds.
-
Select the number of devices that should be in error or warning to trigger the alert.
To learn more about configuring performance alerts, see Performance Alerts.
-
-
Click Save in the top right corner to save the changes.
Now, configure recipients for alerts:
-
From the top menu, select Alerts > Alert Recipients.
-
To create a new recipient, click New Recipient and specify the contact information.
-
Select the recipient in the list and click next to the recipient.
-
To receive alerts about errors, enable them in the Availability Alerts section.
-
To receive response time alerts, enable them in the Performance Alerts section.
-
Configure other recipient settings as needed.
-
Click Save.
| Note: | If you have many recipients in AlertSite, but you want to send BitBar monitor alerts only to specific recipients, you need to create a recipient group for the monitor and its alert recipients. For instructions, see Recipient Groups. |
View monitoring status in AlertSite
You can see the status of your monitoring scripts on the AlertSite dashboard. The response time displayed is the total UX time of all transactions in the test run. If a monitor discovers an error, it turns red and is moved to the top of the dashboard.
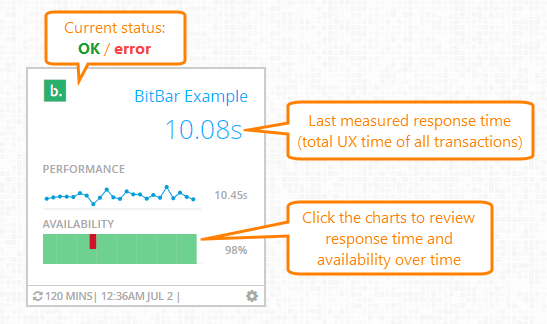
To view detailed results, you can either click the charts on the tiles or manually navigate the following dashboards:
-
Monitors > Availability – Shows the monitor status (OK/error) over time, as a total and per individual mobile devices.
-
Monitors > Performance – Shows the response time over time, as an average or per individual mobile devices.
-
Monitors > Runs – Shows all monitor runs and results as a list.
See Common status codes for status code descriptions and troubleshooting tips.
View BitBar execution reports
You can access BitBar monitor reports from AlertSite. First, go to Monitors > Runs, select your monitor, and choose a time period at the top. You will see all the test results for that period. You can filter the runs by status (OK/error) or sort them by execution time to find the needed results. Expand the runs to see the results of individual transactions.
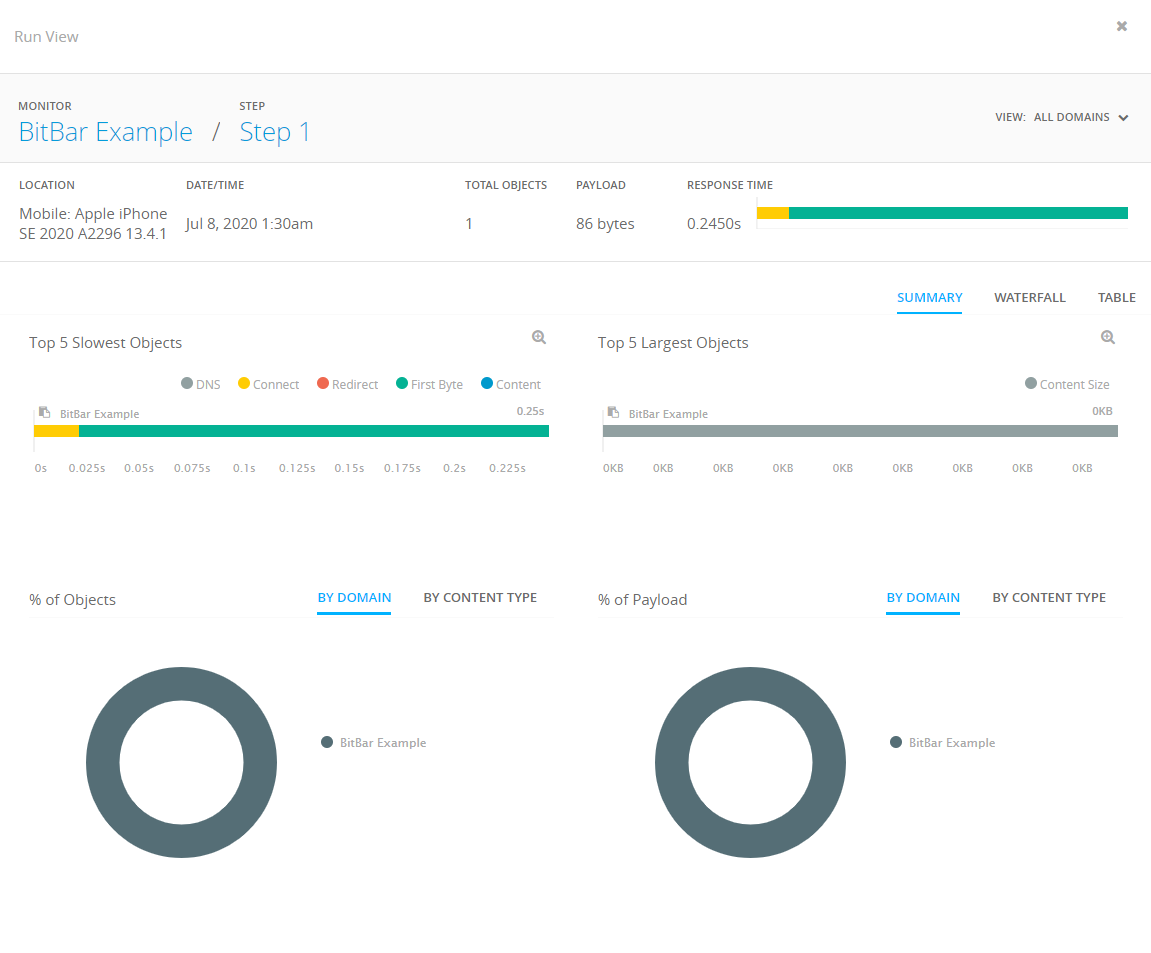
In the expanded run, click next to a transaction step to view the page's Waterfall report and analyze the page loading timeline, content breakdown, top slowest resources, top largest resources, and so on.
Failed runs with status 5300 may not have an associated BitBar report. In this case, click Request Log on the Monitor Runs dashboard to view the AlertSite error log. The first error in the log indicates the reason why the test failed. See Common status codes below for some typical errors.
AlertSite Reports
AlertSite provides a set of reports that you can download, print, or email.
To create a cumulative report:
-
Go to Reports > Performance Reports.
-
Select the report type, the monitor, and the report period.
-
Click Run Report.
Once the report is created, you can view it, download, email, or schedule it as a recurring email report. You can also access all preciously created reports in Reports > Document Manager.
To view the AlertSite report for a specific test run, do any of the following:
-
In Monitors > Runs, expand a run and click Detail Report.
-
In Monitors > Summary > Availability History, click a time range, then click a specific run. In the tooltip, click View Detail Report.
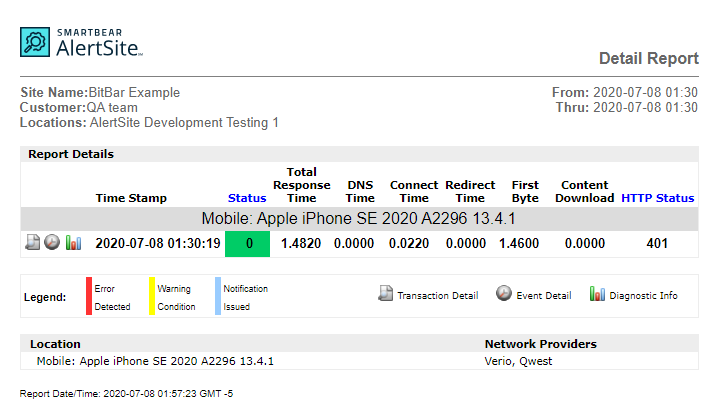
This opens the Detail report for that run, with the status and response time of all transactions in your BitBar test run.
Reports contain test results as a table. You can expand a test to see the transactions performed in that test, their status, and response time.
Common status codes
This table contains some common error codes used by BitBar monitors in AlertSite. For other status codes, please see AlertSite Status Codes.
| Status | Description | Possible Causes and Solutions |
|---|---|---|
| 0 | Site is OK now | The test completed successfully. |
| 2 | Test timed out | Status 2 is a failed time checkpoint. This usually means your application is busy and is experiencing a slowdown. If the response time looks normal, review the timers in your test run, and increase the timeouts. |
| 5 | Validation failed | Status 5 is a failed checkpoint, meaning the expected text or image was not found in your application. You can see the checkpoint condition and results in the BitBar execution report. If everything looks OK, review the checkpoint conditions in the test run. |
| 95 | Unable to monitor |
Unable to run the test run in BitBar.
Note: Status 95 “Unable to monitor” appears only on the main Dashboard, in Monitor Summary and Monitor Availability. No new entries are added to the monitor run history because this status usually indicates a temporary condition. |
| 50XX | BitBar specific error | Status codes with format 50XX indicate that an error occurred while processing BitBar results. The last 2 digits (XX) are interpreted using other AlertSite status codes. |
| 5081 | Maximum transaction time was exceeded |
There was no BitBar device available within the default timeout interval. This usually indicates that the system is very busy. We recommend that you use dedicated devices reserved solely for your use. To purchase dedicated devices, contact BitBar Sales. |
| 5300 | Service execution error | There was a problem running your BitBar script. To view the error message, go to Monitors > Runs, expand the failed run, and click Request Log. |
Troubleshooting
Error when creating a BitBar monitor: "Your primary home location does not support Mobile Monitoring"
This happens if the default primary location specified in your AlertSite account preferences is other than Fort Lauderdale or Atlanta. To avoid the issue, you need to temporarily change your default primary location:
-
From the top menu, select > Settings.
-
Switch to the Public Locations tab.
-
Select Fort Lauderdale or Atlanta as the Primary location.
-
Click Save.
Then, create your BitBar monitor.
After that, you can revert to your previous location settings.
What’s next
- Scheduling Monitor Blackouts – Define maintenance windows to prevent script runs during device maintenance periods.
- Alerts – learn more about the AlertSite notification system.
- Reporting – Schedule daily, weekly, or monthly reports.
- SLA Monitoring – define your availability and performance requirements, and monitor SLA compliance.

