
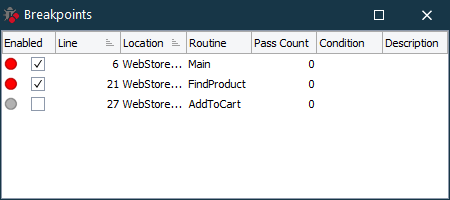
The Breakpoints panel displays all breakpoints that are currently set in your project suite.
The following image shows the overall view of the Breakpoints panel:
Displaying the Panel
By default, the Breakpoints panel resides at the bottom of the Workspace panel. If the Breakpoints panel is hidden, you can do one of the following to display it:
-
Click the
 button on the Debug toolbar.
 -
Press the View > Debug > Breakpoints shortcut. The default shortcut depends on the keyboard mapping scheme chosen in the Customize Keyboard dialog. For the Visual Studio Emulation scheme, it is Ctrl+B. For the Borland Classic and Default schemes, it is Ctrl+Alt+B. You can also change the assigned shortcut via the Customize Keyboard dialog.
-
Select View > Debug > Breakpoints from the main menu.
-
Choose View > Select Panel from the TestComplete main menu and then choose Breakpoints from the ensuing Select Panel dialog.
Information on the Panel
| To learn more about … | See these topics … |
|---|---|
| Breakpoints displayed in the panel | Breakpoints Panel Content |
| Tasks you can perform in the panel | Breakpoints Panel - Common Tasks |
TestComplete allows you to customize the layout of any of its panels to better meet your needs. For example, you can change the Breakpoints panel’s size, position and docking, hide the panel or make it visible. To learn how to customize the TestComplete interface, see Customizing TestComplete.
See Also
Using Breakpoints
Conditional Breakpoints
Debugging Tests - Overview
Breakpoint Properties Dialog